Propionibacteriaceae bacterium NML 150081
Taxonomy: cellular organisms; Bacteria; Terrabacteria group; Actinobacteria; Actinomycetia; Propionibacteriales; Propionibacteriaceae; unclassified Propionibacteriaceae
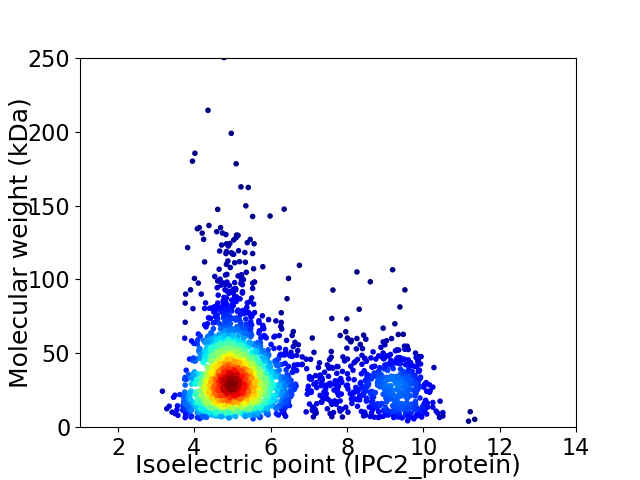
Average proteome isoelectric point is 5.86
Get precalculated fractions of proteins

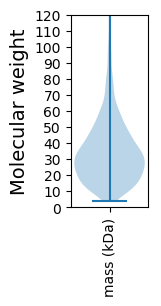
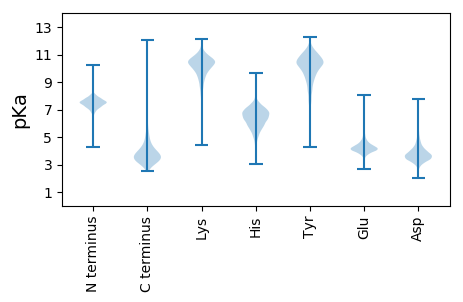
Virtual 2D-PAGE plot for 2661 proteins (isoelectric point calculated using IPC2_protein)
Get csv file with sequences according to given criteria:
* You can choose from 21 different methods for calculating isoelectric point
Summary statistics related to proteome-wise predictions


Protein with the lowest isoelectric point:
>tr|A0A255EJC1|A0A255EJC1_9ACTN Uncharacterized protein OS=Propionibacteriaceae bacterium NML 150081 OX=2016505 GN=CGZ91_11650 PE=4 SV=1
MM1 pKa = 7.33TSKK4 pKa = 10.58FDD6 pKa = 4.61DD7 pKa = 4.12MDD9 pKa = 3.17WHH11 pKa = 7.24LGGDD15 pKa = 4.48DD16 pKa = 4.9FPDD19 pKa = 4.35DD20 pKa = 4.29LPEE23 pKa = 4.0EE24 pKa = 4.3AAATHH29 pKa = 6.03IGMYY33 pKa = 7.4FTWLVEE39 pKa = 4.05RR40 pKa = 11.84GLVGEE45 pKa = 4.34DD46 pKa = 3.12LVRR49 pKa = 11.84EE50 pKa = 4.21HH51 pKa = 7.01GAALDD56 pKa = 3.78QVRR59 pKa = 11.84SGQLRR64 pKa = 11.84GSGFIVDD71 pKa = 3.67QCDD74 pKa = 3.65GQLLAQYY81 pKa = 8.36LTEE84 pKa = 4.12VGAAFTEE91 pKa = 4.43HH92 pKa = 7.05VYY94 pKa = 11.09DD95 pKa = 4.87SYY97 pKa = 11.89LEE99 pKa = 4.76EE100 pKa = 4.25YY101 pKa = 10.59GNWGDD106 pKa = 3.78PNVNIYY112 pKa = 10.67ALPDD116 pKa = 3.35NDD118 pKa = 3.38EE119 pKa = 4.7TYY121 pKa = 11.11SEE123 pKa = 4.33VQDD126 pKa = 4.43LLDD129 pKa = 3.74SRR131 pKa = 11.84FAEE134 pKa = 4.22WDD136 pKa = 3.48PSS138 pKa = 3.47
MM1 pKa = 7.33TSKK4 pKa = 10.58FDD6 pKa = 4.61DD7 pKa = 4.12MDD9 pKa = 3.17WHH11 pKa = 7.24LGGDD15 pKa = 4.48DD16 pKa = 4.9FPDD19 pKa = 4.35DD20 pKa = 4.29LPEE23 pKa = 4.0EE24 pKa = 4.3AAATHH29 pKa = 6.03IGMYY33 pKa = 7.4FTWLVEE39 pKa = 4.05RR40 pKa = 11.84GLVGEE45 pKa = 4.34DD46 pKa = 3.12LVRR49 pKa = 11.84EE50 pKa = 4.21HH51 pKa = 7.01GAALDD56 pKa = 3.78QVRR59 pKa = 11.84SGQLRR64 pKa = 11.84GSGFIVDD71 pKa = 3.67QCDD74 pKa = 3.65GQLLAQYY81 pKa = 8.36LTEE84 pKa = 4.12VGAAFTEE91 pKa = 4.43HH92 pKa = 7.05VYY94 pKa = 11.09DD95 pKa = 4.87SYY97 pKa = 11.89LEE99 pKa = 4.76EE100 pKa = 4.25YY101 pKa = 10.59GNWGDD106 pKa = 3.78PNVNIYY112 pKa = 10.67ALPDD116 pKa = 3.35NDD118 pKa = 3.38EE119 pKa = 4.7TYY121 pKa = 11.11SEE123 pKa = 4.33VQDD126 pKa = 4.43LLDD129 pKa = 3.74SRR131 pKa = 11.84FAEE134 pKa = 4.22WDD136 pKa = 3.48PSS138 pKa = 3.47
Molecular weight: 15.56 kDa
Isoelectric point according different methods:
Protein with the highest isoelectric point:
>tr|A0A255EFH9|A0A255EFH9_9ACTN Ribonuclease P protein component OS=Propionibacteriaceae bacterium NML 150081 OX=2016505 GN=rnpA PE=3 SV=1
MM1 pKa = 7.69SKK3 pKa = 9.01RR4 pKa = 11.84TFQPSNRR11 pKa = 11.84RR12 pKa = 11.84RR13 pKa = 11.84SRR15 pKa = 11.84THH17 pKa = 6.18GFRR20 pKa = 11.84LRR22 pKa = 11.84MRR24 pKa = 11.84TRR26 pKa = 11.84AGRR29 pKa = 11.84AIMSSRR35 pKa = 11.84RR36 pKa = 11.84RR37 pKa = 11.84KK38 pKa = 9.85GRR40 pKa = 11.84AKK42 pKa = 10.71LAGG45 pKa = 3.63
MM1 pKa = 7.69SKK3 pKa = 9.01RR4 pKa = 11.84TFQPSNRR11 pKa = 11.84RR12 pKa = 11.84RR13 pKa = 11.84SRR15 pKa = 11.84THH17 pKa = 6.18GFRR20 pKa = 11.84LRR22 pKa = 11.84MRR24 pKa = 11.84TRR26 pKa = 11.84AGRR29 pKa = 11.84AIMSSRR35 pKa = 11.84RR36 pKa = 11.84RR37 pKa = 11.84KK38 pKa = 9.85GRR40 pKa = 11.84AKK42 pKa = 10.71LAGG45 pKa = 3.63
Molecular weight: 5.34 kDa
Isoelectric point according different methods:
Peptides (in silico digests for buttom-up proteomics)
Below you can find in silico digests of the whole proteome with Trypsin, Chymotrypsin, Trypsin+LysC, LysN, ArgC proteases suitable for different mass spec machines.| Try ESI |
 |
|---|
| ChTry ESI |
 |
|---|
| ArgC ESI |
 |
|---|
| LysN ESI |
 |
|---|
| TryLysC ESI |
 |
|---|
| Try MALDI |
 |
|---|
| ChTry MALDI |
 |
|---|
| ArgC MALDI |
 |
|---|
| LysN MALDI |
 |
|---|
| TryLysC MALDI |
 |
|---|
| Try LTQ |
 |
|---|
| ChTry LTQ |
 |
|---|
| ArgC LTQ |
 |
|---|
| LysN LTQ |
 |
|---|
| TryLysC LTQ |
 |
|---|
| Try MSlow |
 |
|---|
| ChTry MSlow |
 |
|---|
| ArgC MSlow |
 |
|---|
| LysN MSlow |
 |
|---|
| TryLysC MSlow |
 |
|---|
| Try MShigh |
 |
|---|
| ChTry MShigh |
 |
|---|
| ArgC MShigh |
 |
|---|
| LysN MShigh |
 |
|---|
| TryLysC MShigh |
 |
|---|
General Statistics
Number of major isoforms |
Number of additional isoforms |
Number of all proteins |
Number of amino acids |
Min. Seq. Length |
Max. Seq. Length |
Avg. Seq. Length |
Avg. Mol. Weight |
|---|---|---|---|---|---|---|---|
0 |
906985 |
33 |
2359 |
340.8 |
36.69 |
Amino acid frequency
Ala |
Cys |
Asp |
Glu |
Phe |
Gly |
His |
Ile |
Lys |
Leu |
|---|---|---|---|---|---|---|---|---|---|
12.475 ± 0.064 | 0.678 ± 0.012 |
6.277 ± 0.041 | 6.024 ± 0.043 |
2.742 ± 0.025 | 9.014 ± 0.045 |
2.212 ± 0.025 | 4.181 ± 0.032 |
1.975 ± 0.031 | 9.983 ± 0.061 |
Met |
Asn |
Gln |
Pro |
Arg |
Ser |
Thr |
Val |
Trp |
Tyr |
|---|---|---|---|---|---|---|---|---|---|
2.02 ± 0.021 | 2.09 ± 0.027 |
5.819 ± 0.045 | 3.666 ± 0.033 |
7.124 ± 0.05 | 5.441 ± 0.027 |
6.038 ± 0.039 | 8.534 ± 0.042 |
1.74 ± 0.022 | 1.969 ± 0.022 |
Most of the basic statistics you can see at this page can be downloaded from this CSV file
Proteome-pI is available under Creative Commons Attribution-NoDerivs license, for more details see here
| Reference: Kozlowski LP. Proteome-pI 2.0: Proteome Isoelectric Point Database Update. Nucleic Acids Res. 2021, doi: 10.1093/nar/gkab944 | Contact: Lukasz P. Kozlowski |
