Hespellia stercorisuis DSM 15480
Taxonomy: cellular organisms; Bacteria; Terrabacteria group; Firmicutes; Clostridia; Eubacteriales; Lachnospiraceae; Hespellia; Hespellia stercorisuis
Average proteome isoelectric point is 6.07
Get precalculated fractions of proteins

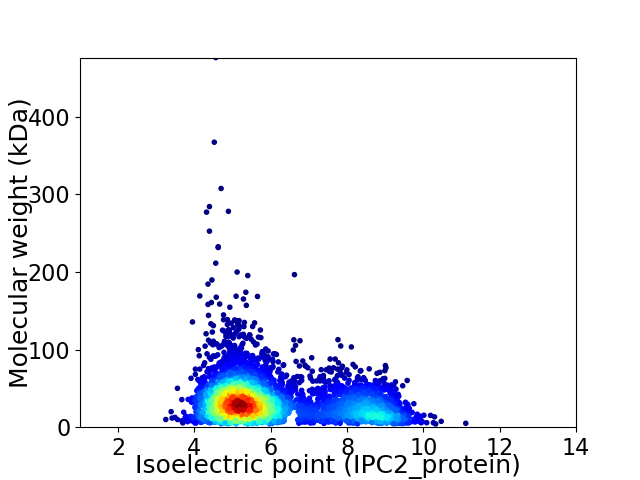
Virtual 2D-PAGE plot for 4054 proteins (isoelectric point calculated using IPC2_protein)
Get csv file with sequences according to given criteria:
* You can choose from 21 different methods for calculating isoelectric point
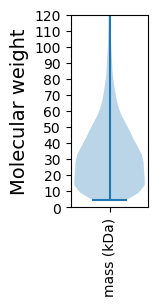
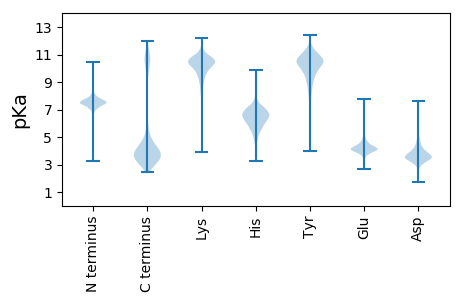
Summary statistics related to proteome-wise predictions


Protein with the lowest isoelectric point:
>tr|A0A1M6MU35|A0A1M6MU35_9FIRM L-threonine aldolase OS=Hespellia stercorisuis DSM 15480 OX=1121950 GN=SAMN02745243_01586 PE=4 SV=1
MM1 pKa = 7.22KK2 pKa = 10.16KK3 pKa = 10.15KK4 pKa = 10.68VIAALMCAALVLGMTACGSSSDD26 pKa = 3.85SSSGSSAKK34 pKa = 10.21KK35 pKa = 9.9EE36 pKa = 4.22SGGDD40 pKa = 3.48GYY42 pKa = 11.42KK43 pKa = 9.95IGFTDD48 pKa = 3.58NYY50 pKa = 10.27NGNSYY55 pKa = 8.92HH56 pKa = 7.29QSMEE60 pKa = 3.74KK61 pKa = 10.64YY62 pKa = 7.76MQEE65 pKa = 4.18VADD68 pKa = 4.21EE69 pKa = 4.37LKK71 pKa = 10.83KK72 pKa = 11.21SGDD75 pKa = 3.24ISEE78 pKa = 4.28LTIAEE83 pKa = 4.36ANQDD87 pKa = 3.28AATQISQIEE96 pKa = 4.31DD97 pKa = 3.47FVMQGYY103 pKa = 10.05DD104 pKa = 4.08LIVVDD109 pKa = 4.61PCSTSSLNSAVQEE122 pKa = 4.26ACDD125 pKa = 3.49AGIPVLVINDD135 pKa = 3.75GPIDD139 pKa = 3.79YY140 pKa = 10.79EE141 pKa = 4.03NDD143 pKa = 2.98LVYY146 pKa = 10.76QLNFDD151 pKa = 4.19FTDD154 pKa = 3.8LAYY157 pKa = 9.55TLTKK161 pKa = 9.89EE162 pKa = 4.0VCEE165 pKa = 4.07QIGGKK170 pKa = 10.39GSIIEE175 pKa = 4.1LRR177 pKa = 11.84GTAGTTCDD185 pKa = 3.44TQMHH189 pKa = 6.33EE190 pKa = 4.6GVEE193 pKa = 4.38KK194 pKa = 10.61ALKK197 pKa = 9.75EE198 pKa = 4.07YY199 pKa = 10.02PDD201 pKa = 3.49VKK203 pKa = 10.13IASEE207 pKa = 5.03IYY209 pKa = 10.12TDD211 pKa = 3.35WTGSKK216 pKa = 10.1AQSEE220 pKa = 4.77LNSVLPTLDD229 pKa = 3.57KK230 pKa = 11.39VDD232 pKa = 3.88GLVTQGGDD240 pKa = 2.67AYY242 pKa = 10.79AAVQAFTSAGYY253 pKa = 10.21SEE255 pKa = 5.37LPVIAGDD262 pKa = 3.63NRR264 pKa = 11.84GSFLSWWAKK273 pKa = 9.88DD274 pKa = 3.37APEE277 pKa = 4.78GYY279 pKa = 8.15EE280 pKa = 4.3TISGACNPWDD290 pKa = 3.91GGMAMYY296 pKa = 10.24IAVDD300 pKa = 3.5ILNGEE305 pKa = 4.19DD306 pKa = 3.14VANNMNCPFGYY317 pKa = 10.56VKK319 pKa = 10.78ADD321 pKa = 3.89DD322 pKa = 3.78VAQYY326 pKa = 11.76ADD328 pKa = 3.39MAEE331 pKa = 4.59DD332 pKa = 4.13EE333 pKa = 4.7VASTSYY339 pKa = 11.26DD340 pKa = 2.92WDD342 pKa = 4.26TIKK345 pKa = 11.0SDD347 pKa = 3.74IEE349 pKa = 3.96PGKK352 pKa = 10.75
MM1 pKa = 7.22KK2 pKa = 10.16KK3 pKa = 10.15KK4 pKa = 10.68VIAALMCAALVLGMTACGSSSDD26 pKa = 3.85SSSGSSAKK34 pKa = 10.21KK35 pKa = 9.9EE36 pKa = 4.22SGGDD40 pKa = 3.48GYY42 pKa = 11.42KK43 pKa = 9.95IGFTDD48 pKa = 3.58NYY50 pKa = 10.27NGNSYY55 pKa = 8.92HH56 pKa = 7.29QSMEE60 pKa = 3.74KK61 pKa = 10.64YY62 pKa = 7.76MQEE65 pKa = 4.18VADD68 pKa = 4.21EE69 pKa = 4.37LKK71 pKa = 10.83KK72 pKa = 11.21SGDD75 pKa = 3.24ISEE78 pKa = 4.28LTIAEE83 pKa = 4.36ANQDD87 pKa = 3.28AATQISQIEE96 pKa = 4.31DD97 pKa = 3.47FVMQGYY103 pKa = 10.05DD104 pKa = 4.08LIVVDD109 pKa = 4.61PCSTSSLNSAVQEE122 pKa = 4.26ACDD125 pKa = 3.49AGIPVLVINDD135 pKa = 3.75GPIDD139 pKa = 3.79YY140 pKa = 10.79EE141 pKa = 4.03NDD143 pKa = 2.98LVYY146 pKa = 10.76QLNFDD151 pKa = 4.19FTDD154 pKa = 3.8LAYY157 pKa = 9.55TLTKK161 pKa = 9.89EE162 pKa = 4.0VCEE165 pKa = 4.07QIGGKK170 pKa = 10.39GSIIEE175 pKa = 4.1LRR177 pKa = 11.84GTAGTTCDD185 pKa = 3.44TQMHH189 pKa = 6.33EE190 pKa = 4.6GVEE193 pKa = 4.38KK194 pKa = 10.61ALKK197 pKa = 9.75EE198 pKa = 4.07YY199 pKa = 10.02PDD201 pKa = 3.49VKK203 pKa = 10.13IASEE207 pKa = 5.03IYY209 pKa = 10.12TDD211 pKa = 3.35WTGSKK216 pKa = 10.1AQSEE220 pKa = 4.77LNSVLPTLDD229 pKa = 3.57KK230 pKa = 11.39VDD232 pKa = 3.88GLVTQGGDD240 pKa = 2.67AYY242 pKa = 10.79AAVQAFTSAGYY253 pKa = 10.21SEE255 pKa = 5.37LPVIAGDD262 pKa = 3.63NRR264 pKa = 11.84GSFLSWWAKK273 pKa = 9.88DD274 pKa = 3.37APEE277 pKa = 4.78GYY279 pKa = 8.15EE280 pKa = 4.3TISGACNPWDD290 pKa = 3.91GGMAMYY296 pKa = 10.24IAVDD300 pKa = 3.5ILNGEE305 pKa = 4.19DD306 pKa = 3.14VANNMNCPFGYY317 pKa = 10.56VKK319 pKa = 10.78ADD321 pKa = 3.89DD322 pKa = 3.78VAQYY326 pKa = 11.76ADD328 pKa = 3.39MAEE331 pKa = 4.59DD332 pKa = 4.13EE333 pKa = 4.7VASTSYY339 pKa = 11.26DD340 pKa = 2.92WDD342 pKa = 4.26TIKK345 pKa = 11.0SDD347 pKa = 3.74IEE349 pKa = 3.96PGKK352 pKa = 10.75
Molecular weight: 37.68 kDa
Isoelectric point according different methods:
Protein with the highest isoelectric point:
>tr|A0A1M6RAJ8|A0A1M6RAJ8_9FIRM Endonuclease MutS2 OS=Hespellia stercorisuis DSM 15480 OX=1121950 GN=mutS2 PE=3 SV=1
MM1 pKa = 7.67KK2 pKa = 8.72MTFQPKK8 pKa = 9.06KK9 pKa = 8.03RR10 pKa = 11.84SRR12 pKa = 11.84SKK14 pKa = 9.44VHH16 pKa = 6.17GFRR19 pKa = 11.84ARR21 pKa = 11.84MSSPGGRR28 pKa = 11.84KK29 pKa = 8.84VLQARR34 pKa = 11.84RR35 pKa = 11.84AKK37 pKa = 10.19GRR39 pKa = 11.84KK40 pKa = 8.18QLSAA44 pKa = 3.9
MM1 pKa = 7.67KK2 pKa = 8.72MTFQPKK8 pKa = 9.06KK9 pKa = 8.03RR10 pKa = 11.84SRR12 pKa = 11.84SKK14 pKa = 9.44VHH16 pKa = 6.17GFRR19 pKa = 11.84ARR21 pKa = 11.84MSSPGGRR28 pKa = 11.84KK29 pKa = 8.84VLQARR34 pKa = 11.84RR35 pKa = 11.84AKK37 pKa = 10.19GRR39 pKa = 11.84KK40 pKa = 8.18QLSAA44 pKa = 3.9
Molecular weight: 5.04 kDa
Isoelectric point according different methods:
Peptides (in silico digests for buttom-up proteomics)
Below you can find in silico digests of the whole proteome with Trypsin, Chymotrypsin, Trypsin+LysC, LysN, ArgC proteases suitable for different mass spec machines.| Try ESI |
 |
|---|
| ChTry ESI |
 |
|---|
| ArgC ESI |
 |
|---|
| LysN ESI |
 |
|---|
| TryLysC ESI |
 |
|---|
| Try MALDI |
 |
|---|
| ChTry MALDI |
 |
|---|
| ArgC MALDI |
 |
|---|
| LysN MALDI |
 |
|---|
| TryLysC MALDI |
 |
|---|
| Try LTQ |
 |
|---|
| ChTry LTQ |
 |
|---|
| ArgC LTQ |
 |
|---|
| LysN LTQ |
 |
|---|
| TryLysC LTQ |
 |
|---|
| Try MSlow |
 |
|---|
| ChTry MSlow |
 |
|---|
| ArgC MSlow |
 |
|---|
| LysN MSlow |
 |
|---|
| TryLysC MSlow |
 |
|---|
| Try MShigh |
 |
|---|
| ChTry MShigh |
 |
|---|
| ArgC MShigh |
 |
|---|
| LysN MShigh |
 |
|---|
| TryLysC MShigh |
 |
|---|
General Statistics
Number of major isoforms |
Number of additional isoforms |
Number of all proteins |
Number of amino acids |
Min. Seq. Length |
Max. Seq. Length |
Avg. Seq. Length |
Avg. Mol. Weight |
|---|---|---|---|---|---|---|---|
0 |
1281107 |
39 |
4450 |
316.0 |
35.4 |
Amino acid frequency
Ala |
Cys |
Asp |
Glu |
Phe |
Gly |
His |
Ile |
Lys |
Leu |
|---|---|---|---|---|---|---|---|---|---|
7.59 ± 0.046 | 1.456 ± 0.017 |
5.713 ± 0.036 | 7.76 ± 0.052 |
3.912 ± 0.024 | 7.069 ± 0.044 |
1.73 ± 0.018 | 7.216 ± 0.038 |
6.901 ± 0.039 | 8.703 ± 0.046 |
Met |
Asn |
Gln |
Pro |
Arg |
Ser |
Thr |
Val |
Trp |
Tyr |
|---|---|---|---|---|---|---|---|---|---|
3.158 ± 0.024 | 4.366 ± 0.03 |
3.154 ± 0.02 | 3.438 ± 0.024 |
4.382 ± 0.034 | 5.807 ± 0.033 |
5.697 ± 0.051 | 7.017 ± 0.034 |
0.887 ± 0.013 | 4.044 ± 0.027 |
Most of the basic statistics you can see at this page can be downloaded from this CSV file
Proteome-pI is available under Creative Commons Attribution-NoDerivs license, for more details see here
| Reference: Kozlowski LP. Proteome-pI 2.0: Proteome Isoelectric Point Database Update. Nucleic Acids Res. 2021, doi: 10.1093/nar/gkab944 | Contact: Lukasz P. Kozlowski |
