Anaerotruncus sp. 22A2-44
Taxonomy: cellular organisms; Bacteria; Terrabacteria group; Firmicutes; Clostridia; Eubacteriales; Oscillospiraceae; Anaerotruncus; unclassified Anaerotruncus
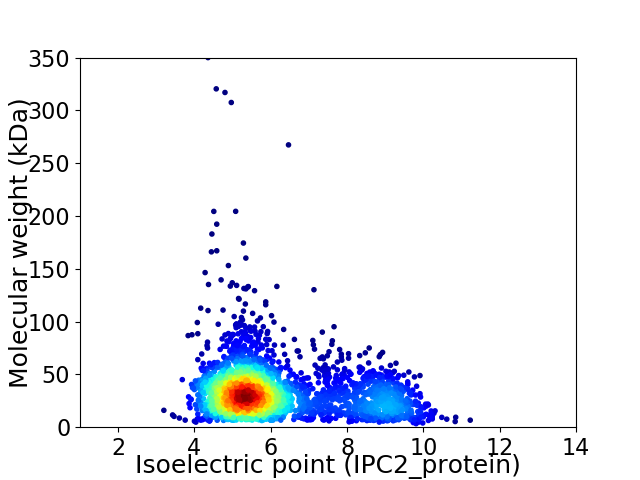
Average proteome isoelectric point is 6.14
Get precalculated fractions of proteins

Virtual 2D-PAGE plot for 2733 proteins (isoelectric point calculated using IPC2_protein)
Get csv file with sequences according to given criteria:
* You can choose from 21 different methods for calculating isoelectric point
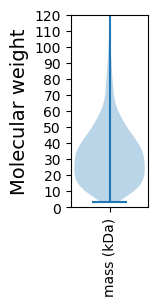
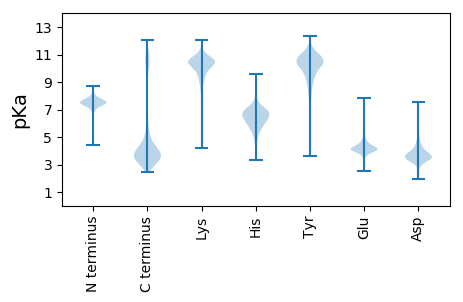
Summary statistics related to proteome-wise predictions


Protein with the lowest isoelectric point:
>tr|A0A498CRV6|A0A498CRV6_9FIRM Uncharacterized protein OS=Anaerotruncus sp. 22A2-44 OX=2321404 GN=D4A47_05095 PE=4 SV=1
MM1 pKa = 7.38NGKK4 pKa = 10.05KK5 pKa = 9.0MLALLLAVVMAVMPLSGCSMKK26 pKa = 10.71GAAEE30 pKa = 3.94QPAAPSAAPADD41 pKa = 4.05EE42 pKa = 4.47VPADD46 pKa = 3.6KK47 pKa = 10.91TEE49 pKa = 3.85AVAPGEE55 pKa = 4.06EE56 pKa = 4.14KK57 pKa = 10.22QLKK60 pKa = 9.81IGFSIITLTFPYY72 pKa = 9.05YY73 pKa = 11.41VKK75 pKa = 10.41MLDD78 pKa = 3.71GFEE81 pKa = 4.33AACKK85 pKa = 9.42EE86 pKa = 4.17KK87 pKa = 10.55GWDD90 pKa = 3.6YY91 pKa = 11.44VYY93 pKa = 10.64TDD95 pKa = 3.49AGMDD99 pKa = 3.52VEE101 pKa = 4.9KK102 pKa = 10.19TVNDD106 pKa = 4.21CLDD109 pKa = 3.83LTLKK113 pKa = 10.91DD114 pKa = 3.05IDD116 pKa = 4.21ALVIASWYY124 pKa = 10.23GDD126 pKa = 3.39SLQDD130 pKa = 4.41VFEE133 pKa = 4.09QCKK136 pKa = 9.67AANIPVFLIDD146 pKa = 4.15TGSLPPDD153 pKa = 3.62GDD155 pKa = 3.95YY156 pKa = 9.98VTNIGTVDD164 pKa = 4.21FDD166 pKa = 3.43AGYY169 pKa = 11.07NGGYY173 pKa = 8.16WAAGQMKK180 pKa = 9.62EE181 pKa = 3.96AGKK184 pKa = 9.83EE185 pKa = 3.83AVRR188 pKa = 11.84MISFTTATSNGRR200 pKa = 11.84NRR202 pKa = 11.84ADD204 pKa = 3.41GFVKK208 pKa = 10.48GLEE211 pKa = 4.19EE212 pKa = 4.61GGLTVEE218 pKa = 4.89VLNEE222 pKa = 3.74YY223 pKa = 10.63LGDD226 pKa = 3.77SRR228 pKa = 11.84EE229 pKa = 4.35SYY231 pKa = 7.54MTSCEE236 pKa = 4.22DD237 pKa = 3.68ALVTYY242 pKa = 10.14PEE244 pKa = 4.95LDD246 pKa = 3.43LVFAANAQGGLGAYY260 pKa = 7.62DD261 pKa = 3.28ACVAANRR268 pKa = 11.84PEE270 pKa = 4.01VKK272 pKa = 9.96IVGFDD277 pKa = 3.72CEE279 pKa = 4.34DD280 pKa = 3.83EE281 pKa = 4.15EE282 pKa = 5.95VEE284 pKa = 5.47LIDD287 pKa = 5.99KK288 pKa = 7.51GTQYY292 pKa = 10.39IASVMQLPAGMAQQTIQNIEE312 pKa = 3.96DD313 pKa = 3.69YY314 pKa = 9.83LYY316 pKa = 11.32NGATFEE322 pKa = 4.23KK323 pKa = 9.23STPYY327 pKa = 10.68EE328 pKa = 4.02SGVYY332 pKa = 9.18CAQGALTTEE341 pKa = 5.3DD342 pKa = 3.29ILGSKK347 pKa = 9.55
MM1 pKa = 7.38NGKK4 pKa = 10.05KK5 pKa = 9.0MLALLLAVVMAVMPLSGCSMKK26 pKa = 10.71GAAEE30 pKa = 3.94QPAAPSAAPADD41 pKa = 4.05EE42 pKa = 4.47VPADD46 pKa = 3.6KK47 pKa = 10.91TEE49 pKa = 3.85AVAPGEE55 pKa = 4.06EE56 pKa = 4.14KK57 pKa = 10.22QLKK60 pKa = 9.81IGFSIITLTFPYY72 pKa = 9.05YY73 pKa = 11.41VKK75 pKa = 10.41MLDD78 pKa = 3.71GFEE81 pKa = 4.33AACKK85 pKa = 9.42EE86 pKa = 4.17KK87 pKa = 10.55GWDD90 pKa = 3.6YY91 pKa = 11.44VYY93 pKa = 10.64TDD95 pKa = 3.49AGMDD99 pKa = 3.52VEE101 pKa = 4.9KK102 pKa = 10.19TVNDD106 pKa = 4.21CLDD109 pKa = 3.83LTLKK113 pKa = 10.91DD114 pKa = 3.05IDD116 pKa = 4.21ALVIASWYY124 pKa = 10.23GDD126 pKa = 3.39SLQDD130 pKa = 4.41VFEE133 pKa = 4.09QCKK136 pKa = 9.67AANIPVFLIDD146 pKa = 4.15TGSLPPDD153 pKa = 3.62GDD155 pKa = 3.95YY156 pKa = 9.98VTNIGTVDD164 pKa = 4.21FDD166 pKa = 3.43AGYY169 pKa = 11.07NGGYY173 pKa = 8.16WAAGQMKK180 pKa = 9.62EE181 pKa = 3.96AGKK184 pKa = 9.83EE185 pKa = 3.83AVRR188 pKa = 11.84MISFTTATSNGRR200 pKa = 11.84NRR202 pKa = 11.84ADD204 pKa = 3.41GFVKK208 pKa = 10.48GLEE211 pKa = 4.19EE212 pKa = 4.61GGLTVEE218 pKa = 4.89VLNEE222 pKa = 3.74YY223 pKa = 10.63LGDD226 pKa = 3.77SRR228 pKa = 11.84EE229 pKa = 4.35SYY231 pKa = 7.54MTSCEE236 pKa = 4.22DD237 pKa = 3.68ALVTYY242 pKa = 10.14PEE244 pKa = 4.95LDD246 pKa = 3.43LVFAANAQGGLGAYY260 pKa = 7.62DD261 pKa = 3.28ACVAANRR268 pKa = 11.84PEE270 pKa = 4.01VKK272 pKa = 9.96IVGFDD277 pKa = 3.72CEE279 pKa = 4.34DD280 pKa = 3.83EE281 pKa = 4.15EE282 pKa = 5.95VEE284 pKa = 5.47LIDD287 pKa = 5.99KK288 pKa = 7.51GTQYY292 pKa = 10.39IASVMQLPAGMAQQTIQNIEE312 pKa = 3.96DD313 pKa = 3.69YY314 pKa = 9.83LYY316 pKa = 11.32NGATFEE322 pKa = 4.23KK323 pKa = 9.23STPYY327 pKa = 10.68EE328 pKa = 4.02SGVYY332 pKa = 9.18CAQGALTTEE341 pKa = 5.3DD342 pKa = 3.29ILGSKK347 pKa = 9.55
Molecular weight: 37.2 kDa
Isoelectric point according different methods:
Protein with the highest isoelectric point:
>tr|A0A498CKL6|A0A498CKL6_9FIRM Stage 0 sporulation protein A homolog OS=Anaerotruncus sp. 22A2-44 OX=2321404 GN=D4A47_11370 PE=4 SV=1
MM1 pKa = 7.7RR2 pKa = 11.84RR3 pKa = 11.84KK4 pKa = 9.44QPPLLPPLRR13 pKa = 11.84TPPRR17 pKa = 11.84TPPAPPAARR26 pKa = 11.84AGPARR31 pKa = 11.84IRR33 pKa = 11.84PAQAGGPRR41 pKa = 11.84TVPPRR46 pKa = 11.84GQRR49 pKa = 11.84SFSFRR54 pKa = 11.84FPQSNPII61 pKa = 3.55
MM1 pKa = 7.7RR2 pKa = 11.84RR3 pKa = 11.84KK4 pKa = 9.44QPPLLPPLRR13 pKa = 11.84TPPRR17 pKa = 11.84TPPAPPAARR26 pKa = 11.84AGPARR31 pKa = 11.84IRR33 pKa = 11.84PAQAGGPRR41 pKa = 11.84TVPPRR46 pKa = 11.84GQRR49 pKa = 11.84SFSFRR54 pKa = 11.84FPQSNPII61 pKa = 3.55
Molecular weight: 6.67 kDa
Isoelectric point according different methods:
Peptides (in silico digests for buttom-up proteomics)
Below you can find in silico digests of the whole proteome with Trypsin, Chymotrypsin, Trypsin+LysC, LysN, ArgC proteases suitable for different mass spec machines.| Try ESI |
 |
|---|
| ChTry ESI |
 |
|---|
| ArgC ESI |
 |
|---|
| LysN ESI |
 |
|---|
| TryLysC ESI |
 |
|---|
| Try MALDI |
 |
|---|
| ChTry MALDI |
 |
|---|
| ArgC MALDI |
 |
|---|
| LysN MALDI |
 |
|---|
| TryLysC MALDI |
 |
|---|
| Try LTQ |
 |
|---|
| ChTry LTQ |
 |
|---|
| ArgC LTQ |
 |
|---|
| LysN LTQ |
 |
|---|
| TryLysC LTQ |
 |
|---|
| Try MSlow |
 |
|---|
| ChTry MSlow |
 |
|---|
| ArgC MSlow |
 |
|---|
| LysN MSlow |
 |
|---|
| TryLysC MSlow |
 |
|---|
| Try MShigh |
 |
|---|
| ChTry MShigh |
 |
|---|
| ArgC MShigh |
 |
|---|
| LysN MShigh |
 |
|---|
| TryLysC MShigh |
 |
|---|
General Statistics
Number of major isoforms |
Number of additional isoforms |
Number of all proteins |
Number of amino acids |
Min. Seq. Length |
Max. Seq. Length |
Avg. Seq. Length |
Avg. Mol. Weight |
|---|---|---|---|---|---|---|---|
0 |
866568 |
28 |
3342 |
317.1 |
34.68 |
Amino acid frequency
Ala |
Cys |
Asp |
Glu |
Phe |
Gly |
His |
Ile |
Lys |
Leu |
|---|---|---|---|---|---|---|---|---|---|
10.486 ± 0.069 | 1.591 ± 0.021 |
5.606 ± 0.041 | 6.771 ± 0.043 |
3.853 ± 0.037 | 8.698 ± 0.057 |
1.588 ± 0.019 | 5.619 ± 0.041 |
4.368 ± 0.041 | 9.716 ± 0.067 |
Met |
Asn |
Gln |
Pro |
Arg |
Ser |
Thr |
Val |
Trp |
Tyr |
|---|---|---|---|---|---|---|---|---|---|
2.695 ± 0.025 | 3.079 ± 0.031 |
4.468 ± 0.035 | 2.743 ± 0.026 |
6.317 ± 0.057 | 5.453 ± 0.036 |
5.196 ± 0.05 | 7.616 ± 0.038 |
0.878 ± 0.015 | 3.261 ± 0.027 |
Most of the basic statistics you can see at this page can be downloaded from this CSV file
Proteome-pI is available under Creative Commons Attribution-NoDerivs license, for more details see here
| Reference: Kozlowski LP. Proteome-pI 2.0: Proteome Isoelectric Point Database Update. Nucleic Acids Res. 2021, doi: 10.1093/nar/gkab944 | Contact: Lukasz P. Kozlowski |
