Streptomyces buecherae
Taxonomy: cellular organisms; Bacteria; Terrabacteria group; Actinobacteria; Actinomycetia; Streptomycetales; Streptomycetaceae; Streptomyces
Average proteome isoelectric point is 6.49
Get precalculated fractions of proteins
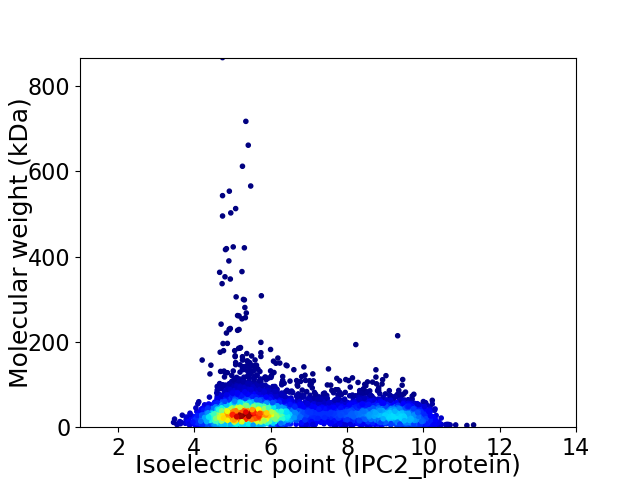
Virtual 2D-PAGE plot for 6802 proteins (isoelectric point calculated using IPC2_protein)
Get csv file with sequences according to given criteria:
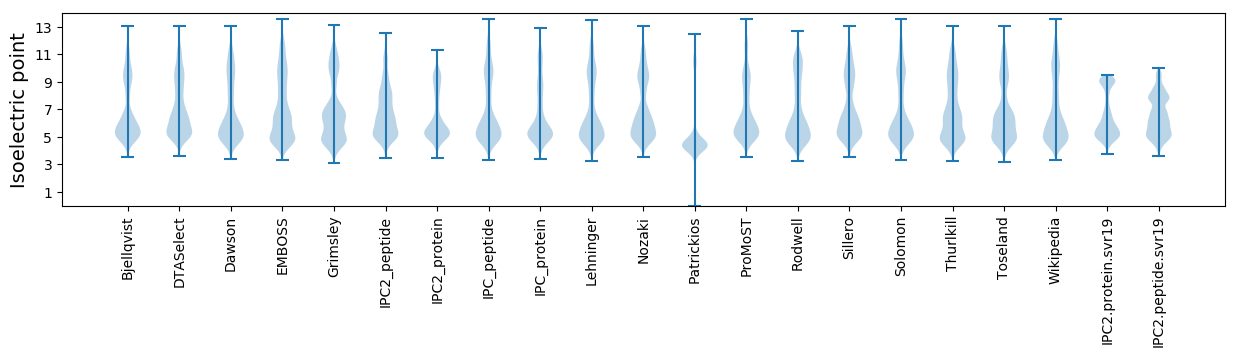
* You can choose from 21 different methods for calculating isoelectric point
Summary statistics related to proteome-wise predictions
Protein with the lowest isoelectric point:
>tr|A0A7H8NCM3|A0A7H8NCM3_9ACTN DUF397 domain-containing protein OS=Streptomyces buecherae OX=2763006 GN=HUT08_24450 PE=4 SV=1
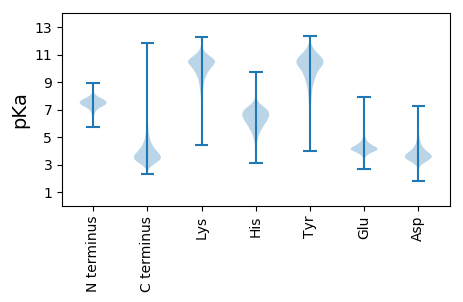
MM1 pKa = 7.12TQTPPPWGTQRR12 pKa = 11.84MGPYY16 pKa = 10.18AATTSVPQYY25 pKa = 10.12TPVIDD30 pKa = 4.68PEE32 pKa = 4.24TQIAVIVDD40 pKa = 3.02EE41 pKa = 4.76HH42 pKa = 6.53GRR44 pKa = 11.84TVDD47 pKa = 3.68LGSHH51 pKa = 5.49GTSTSGLTPTTTAPGDD67 pKa = 3.6GAGPGTATDD76 pKa = 3.76ADD78 pKa = 3.97STEE81 pKa = 5.67SYY83 pKa = 11.11DD84 pKa = 4.11QDD86 pKa = 3.53QSSDD90 pKa = 3.07
MM1 pKa = 7.12TQTPPPWGTQRR12 pKa = 11.84MGPYY16 pKa = 10.18AATTSVPQYY25 pKa = 10.12TPVIDD30 pKa = 4.68PEE32 pKa = 4.24TQIAVIVDD40 pKa = 3.02EE41 pKa = 4.76HH42 pKa = 6.53GRR44 pKa = 11.84TVDD47 pKa = 3.68LGSHH51 pKa = 5.49GTSTSGLTPTTTAPGDD67 pKa = 3.6GAGPGTATDD76 pKa = 3.76ADD78 pKa = 3.97STEE81 pKa = 5.67SYY83 pKa = 11.11DD84 pKa = 4.11QDD86 pKa = 3.53QSSDD90 pKa = 3.07
Molecular weight: 9.25 kDa
Isoelectric point according different methods:
Protein with the highest isoelectric point:
>tr|A0A7G8KP00|A0A7G8KP00_9ACTN ABC transporter permease OS=Streptomyces buecherae OX=2763006 GN=H7H31_32750 PE=3 SV=1
MM1 pKa = 7.69SKK3 pKa = 9.0RR4 pKa = 11.84TFQPNNRR11 pKa = 11.84RR12 pKa = 11.84RR13 pKa = 11.84AKK15 pKa = 8.7THH17 pKa = 5.15GFRR20 pKa = 11.84LRR22 pKa = 11.84MRR24 pKa = 11.84TRR26 pKa = 11.84AGRR29 pKa = 11.84AILASRR35 pKa = 11.84RR36 pKa = 11.84GKK38 pKa = 10.36GRR40 pKa = 11.84ARR42 pKa = 11.84LSAA45 pKa = 3.91
MM1 pKa = 7.69SKK3 pKa = 9.0RR4 pKa = 11.84TFQPNNRR11 pKa = 11.84RR12 pKa = 11.84RR13 pKa = 11.84AKK15 pKa = 8.7THH17 pKa = 5.15GFRR20 pKa = 11.84LRR22 pKa = 11.84MRR24 pKa = 11.84TRR26 pKa = 11.84AGRR29 pKa = 11.84AILASRR35 pKa = 11.84RR36 pKa = 11.84GKK38 pKa = 10.36GRR40 pKa = 11.84ARR42 pKa = 11.84LSAA45 pKa = 3.91
Molecular weight: 5.25 kDa
Isoelectric point according different methods:
Peptides (in silico digests for buttom-up proteomics)
Below you can find in silico digests of the whole proteome with Trypsin, Chymotrypsin, Trypsin+LysC, LysN, ArgC proteases suitable for different mass spec machines.| Try ESI |
 |
|---|
| ChTry ESI |
|
|---|
| ArgC ESI |
|
|---|
| LysN ESI |
|
|---|
| TryLysC ESI |
|
|---|
| Try MALDI |
|
|---|
| ChTry MALDI |
|
|---|
| ArgC MALDI |
|
|---|
| LysN MALDI |
|
|---|
| TryLysC MALDI |
|
|---|
| Try LTQ |
|
|---|
| ChTry LTQ |
|
|---|
| ArgC LTQ |
|
|---|
| LysN LTQ |
|
|---|
| TryLysC LTQ |
|
|---|
| Try MSlow |
|
|---|
| ChTry MSlow |
|
|---|
| ArgC MSlow |
|
|---|
| LysN MSlow |
|
|---|
| TryLysC MSlow |
|
|---|
| Try MShigh |
|
|---|
| ChTry MShigh |
|
|---|
| ArgC MShigh |
|
|---|
| LysN MShigh |
|
|---|
| TryLysC MShigh |
|
|---|
General Statistics
Number of major isoforms |
Number of additional isoforms |
Number of all proteins |
Number of amino acids |
Min. Seq. Length |
Max. Seq. Length |
Avg. Seq. Length |
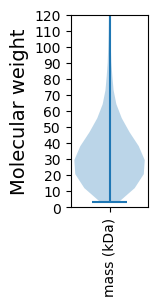
Avg. Mol. Weight |
|---|---|---|---|---|---|---|---|
0 |
2354689 |
29 |
8278 |
346.2 |
36.94 |
Amino acid frequency
Ala |
Cys |
Asp |
Glu |
Phe |
Gly |
His |
Ile |
Lys |
Leu |
|---|---|---|---|---|---|---|---|---|---|
14.444 ± 0.054 | 0.783 ± 0.009 |
6.005 ± 0.02 | 5.65 ± 0.027 |
2.559 ± 0.016 | 9.548 ± 0.035 |
2.405 ± 0.016 | 2.894 ± 0.022 |
1.9 ± 0.028 | 10.139 ± 0.039 |
Met |
Asn |
Gln |
Pro |
Arg |
Ser |
Thr |
Val |
Trp |
Tyr |
|---|---|---|---|---|---|---|---|---|---|
1.594 ± 0.012 | 1.61 ± 0.014 |
6.518 ± 0.035 | 2.76 ± 0.018 |
8.47 ± 0.034 | 4.909 ± 0.024 |
6.009 ± 0.025 | 8.283 ± 0.03 |
1.51 ± 0.012 | 2.01 ± 0.014 |
Most of the basic statistics you can see at this page can be downloaded from this CSV file
See this proteome in:

Proteome-pI is available under Creative Commons Attribution-NoDerivs license, for more details see here
| Reference: Kozlowski LP. Proteome-pI 2.0: Proteome Isoelectric Point Database Update. Nucleic Acids Res. 2021, doi: 10.1093/nar/gkab944 | Contact: Lukasz P. Kozlowski |