Aspergillus tubingensis (strain CBS 134.48)
Taxonomy: cellular organisms; Eukaryota; Opisthokonta; Fungi; Dikarya; Ascomycota; saccharomyceta; Pezizomycotina; leotiomyceta; Eurotiomycetes; Eurotiomycetidae; Eurotiales; Aspergillaceae; Aspergillus; Aspergillus tubingensis
Average proteome isoelectric point is 6.43
Get precalculated fractions of proteins

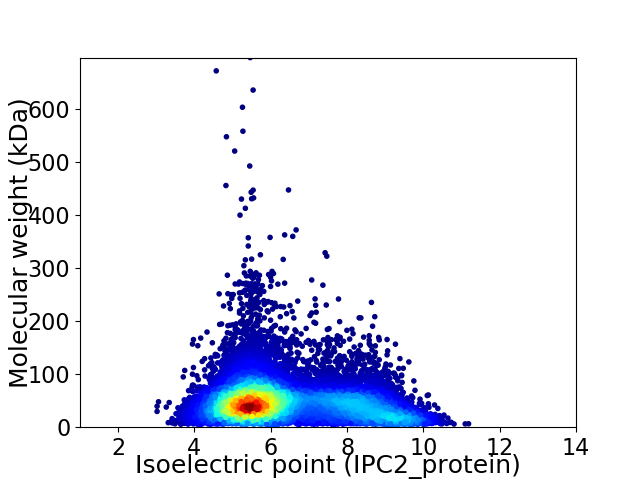
Virtual 2D-PAGE plot for 12319 proteins (isoelectric point calculated using IPC2_protein)
Get csv file with sequences according to given criteria:
* You can choose from 21 different methods for calculating isoelectric point
Summary statistics related to proteome-wise predictions


Protein with the lowest isoelectric point:
>tr|A0A1L9MX80|A0A1L9MX80_ASPTC NAD(P)-bd_dom domain-containing protein OS=Aspergillus tubingensis (strain CBS 134.48) OX=767770 GN=ASPTUDRAFT_125518 PE=4 SV=1
MM1 pKa = 6.89KK2 pKa = 9.88TYY4 pKa = 10.55GIWSTLATLGSFTLSSAKK22 pKa = 9.29TLNFVAHH29 pKa = 7.12EE30 pKa = 4.56DD31 pKa = 3.72DD32 pKa = 5.65DD33 pKa = 5.68LLFLSPDD40 pKa = 4.47LIRR43 pKa = 11.84DD44 pKa = 3.62ILSGEE49 pKa = 4.14PLRR52 pKa = 11.84TVFLTAGDD60 pKa = 3.85AGMGSDD66 pKa = 3.55YY67 pKa = 10.75WNSRR71 pKa = 11.84EE72 pKa = 4.11DD73 pKa = 3.59GSRR76 pKa = 11.84AAYY79 pKa = 10.58ARR81 pKa = 11.84MAVASNNWDD90 pKa = 3.14EE91 pKa = 4.21DD92 pKa = 4.09VIYY95 pKa = 11.19VGDD98 pKa = 3.94KK99 pKa = 10.37TISLYY104 pKa = 10.02TLQDD108 pKa = 3.76DD109 pKa = 5.22DD110 pKa = 5.76DD111 pKa = 5.1ISLAFMHH118 pKa = 6.84LPDD121 pKa = 4.93GNMDD125 pKa = 3.31GTGFGGTDD133 pKa = 3.76QNDD136 pKa = 3.81SLQKK140 pKa = 10.82LWDD143 pKa = 3.55GDD145 pKa = 3.14IDD147 pKa = 4.19VIRR150 pKa = 11.84TIDD153 pKa = 3.57GSGVEE158 pKa = 4.13YY159 pKa = 10.3TRR161 pKa = 11.84DD162 pKa = 3.39EE163 pKa = 4.31LLEE166 pKa = 4.35TIAALIDD173 pKa = 4.57DD174 pKa = 5.25FDD176 pKa = 5.85PDD178 pKa = 3.61EE179 pKa = 4.89VKK181 pKa = 10.28TGDD184 pKa = 3.6YY185 pKa = 11.43VNDD188 pKa = 4.35FGDD191 pKa = 4.38GDD193 pKa = 4.1HH194 pKa = 7.19SDD196 pKa = 4.11HH197 pKa = 6.56YY198 pKa = 9.99ATGYY202 pKa = 10.41FVDD205 pKa = 4.5NALQQADD212 pKa = 3.87SDD214 pKa = 4.31ADD216 pKa = 3.51LTGYY220 pKa = 10.02YY221 pKa = 10.2GYY223 pKa = 9.34PIQNMDD229 pKa = 3.52VNLDD233 pKa = 3.65DD234 pKa = 6.3SDD236 pKa = 5.69IEE238 pKa = 4.29DD239 pKa = 3.65KK240 pKa = 11.42TNIFYY245 pKa = 10.61EE246 pKa = 4.16YY247 pKa = 10.63AGYY250 pKa = 8.18DD251 pKa = 3.49TATCATDD258 pKa = 3.84DD259 pKa = 3.99ACSSRR264 pKa = 11.84PEE266 pKa = 4.27SAWLQRR272 pKa = 11.84EE273 pKa = 4.24YY274 pKa = 11.31EE275 pKa = 4.13LL276 pKa = 5.67
MM1 pKa = 6.89KK2 pKa = 9.88TYY4 pKa = 10.55GIWSTLATLGSFTLSSAKK22 pKa = 9.29TLNFVAHH29 pKa = 7.12EE30 pKa = 4.56DD31 pKa = 3.72DD32 pKa = 5.65DD33 pKa = 5.68LLFLSPDD40 pKa = 4.47LIRR43 pKa = 11.84DD44 pKa = 3.62ILSGEE49 pKa = 4.14PLRR52 pKa = 11.84TVFLTAGDD60 pKa = 3.85AGMGSDD66 pKa = 3.55YY67 pKa = 10.75WNSRR71 pKa = 11.84EE72 pKa = 4.11DD73 pKa = 3.59GSRR76 pKa = 11.84AAYY79 pKa = 10.58ARR81 pKa = 11.84MAVASNNWDD90 pKa = 3.14EE91 pKa = 4.21DD92 pKa = 4.09VIYY95 pKa = 11.19VGDD98 pKa = 3.94KK99 pKa = 10.37TISLYY104 pKa = 10.02TLQDD108 pKa = 3.76DD109 pKa = 5.22DD110 pKa = 5.76DD111 pKa = 5.1ISLAFMHH118 pKa = 6.84LPDD121 pKa = 4.93GNMDD125 pKa = 3.31GTGFGGTDD133 pKa = 3.76QNDD136 pKa = 3.81SLQKK140 pKa = 10.82LWDD143 pKa = 3.55GDD145 pKa = 3.14IDD147 pKa = 4.19VIRR150 pKa = 11.84TIDD153 pKa = 3.57GSGVEE158 pKa = 4.13YY159 pKa = 10.3TRR161 pKa = 11.84DD162 pKa = 3.39EE163 pKa = 4.31LLEE166 pKa = 4.35TIAALIDD173 pKa = 4.57DD174 pKa = 5.25FDD176 pKa = 5.85PDD178 pKa = 3.61EE179 pKa = 4.89VKK181 pKa = 10.28TGDD184 pKa = 3.6YY185 pKa = 11.43VNDD188 pKa = 4.35FGDD191 pKa = 4.38GDD193 pKa = 4.1HH194 pKa = 7.19SDD196 pKa = 4.11HH197 pKa = 6.56YY198 pKa = 9.99ATGYY202 pKa = 10.41FVDD205 pKa = 4.5NALQQADD212 pKa = 3.87SDD214 pKa = 4.31ADD216 pKa = 3.51LTGYY220 pKa = 10.02YY221 pKa = 10.2GYY223 pKa = 9.34PIQNMDD229 pKa = 3.52VNLDD233 pKa = 3.65DD234 pKa = 6.3SDD236 pKa = 5.69IEE238 pKa = 4.29DD239 pKa = 3.65KK240 pKa = 11.42TNIFYY245 pKa = 10.61EE246 pKa = 4.16YY247 pKa = 10.63AGYY250 pKa = 8.18DD251 pKa = 3.49TATCATDD258 pKa = 3.84DD259 pKa = 3.99ACSSRR264 pKa = 11.84PEE266 pKa = 4.27SAWLQRR272 pKa = 11.84EE273 pKa = 4.24YY274 pKa = 11.31EE275 pKa = 4.13LL276 pKa = 5.67
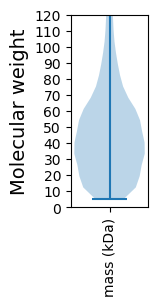
Molecular weight: 30.59 kDa
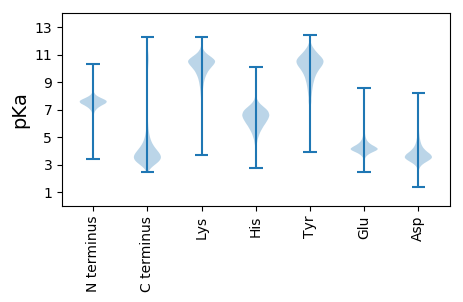
Isoelectric point according different methods:
Protein with the highest isoelectric point:
>tr|A0A1L9N8R7|A0A1L9N8R7_ASPTC Uncharacterized protein OS=Aspergillus tubingensis (strain CBS 134.48) OX=767770 GN=ASPTUDRAFT_927216 PE=4 SV=1
MM1 pKa = 7.56IPTHH5 pKa = 4.89STLRR9 pKa = 11.84RR10 pKa = 11.84RR11 pKa = 11.84SAVRR15 pKa = 11.84SRR17 pKa = 11.84KK18 pKa = 9.78ASVIRR23 pKa = 11.84RR24 pKa = 11.84NFKK27 pKa = 10.39VVTTSGMIRR36 pKa = 11.84RR37 pKa = 11.84SHH39 pKa = 5.98SPFWLLRR46 pKa = 11.84LPVSLIFQVV55 pKa = 3.28
MM1 pKa = 7.56IPTHH5 pKa = 4.89STLRR9 pKa = 11.84RR10 pKa = 11.84RR11 pKa = 11.84SAVRR15 pKa = 11.84SRR17 pKa = 11.84KK18 pKa = 9.78ASVIRR23 pKa = 11.84RR24 pKa = 11.84NFKK27 pKa = 10.39VVTTSGMIRR36 pKa = 11.84RR37 pKa = 11.84SHH39 pKa = 5.98SPFWLLRR46 pKa = 11.84LPVSLIFQVV55 pKa = 3.28
Molecular weight: 6.45 kDa
Isoelectric point according different methods:
Peptides (in silico digests for buttom-up proteomics)
Below you can find in silico digests of the whole proteome with Trypsin, Chymotrypsin, Trypsin+LysC, LysN, ArgC proteases suitable for different mass spec machines.| Try ESI |
 |
|---|
| ChTry ESI |
 |
|---|
| ArgC ESI |
 |
|---|
| LysN ESI |
 |
|---|
| TryLysC ESI |
 |
|---|
| Try MALDI |
 |
|---|
| ChTry MALDI |
 |
|---|
| ArgC MALDI |
 |
|---|
| LysN MALDI |
 |
|---|
| TryLysC MALDI |
 |
|---|
| Try LTQ |
 |
|---|
| ChTry LTQ |
 |
|---|
| ArgC LTQ |
 |
|---|
| LysN LTQ |
 |
|---|
| TryLysC LTQ |
 |
|---|
| Try MSlow |
 |
|---|
| ChTry MSlow |
 |
|---|
| ArgC MSlow |
 |
|---|
| LysN MSlow |
 |
|---|
| TryLysC MSlow |
 |
|---|
| Try MShigh |
 |
|---|
| ChTry MShigh |
 |
|---|
| ArgC MShigh |
 |
|---|
| LysN MShigh |
 |
|---|
| TryLysC MShigh |
 |
|---|
General Statistics
Number of major isoforms |
Number of additional isoforms |
Number of all proteins |
Number of amino acids |
Min. Seq. Length |
Max. Seq. Length |
Avg. Seq. Length |
Avg. Mol. Weight |
|---|---|---|---|---|---|---|---|
5835640 |
49 |
6265 |
473.7 |
52.5 |
Amino acid frequency
Ala |
Cys |
Asp |
Glu |
Phe |
Gly |
His |
Ile |
Lys |
Leu |
|---|---|---|---|---|---|---|---|---|---|
8.387 ± 0.021 | 1.329 ± 0.009 |
5.603 ± 0.014 | 6.074 ± 0.021 |
3.755 ± 0.013 | 6.79 ± 0.02 |
2.466 ± 0.01 | 4.995 ± 0.016 |
4.411 ± 0.017 | 9.17 ± 0.023 |
Met |
Asn |
Gln |
Pro |
Arg |
Ser |
Thr |
Val |
Trp |
Tyr |
|---|---|---|---|---|---|---|---|---|---|
2.198 ± 0.008 | 3.591 ± 0.011 |
6.023 ± 0.024 | 3.996 ± 0.014 |
6.104 ± 0.019 | 8.315 ± 0.025 |
6.055 ± 0.015 | 6.265 ± 0.016 |
1.521 ± 0.008 | 2.953 ± 0.011 |
Most of the basic statistics you can see at this page can be downloaded from this CSV file
Proteome-pI is available under Creative Commons Attribution-NoDerivs license, for more details see here
| Reference: Kozlowski LP. Proteome-pI 2.0: Proteome Isoelectric Point Database Update. Nucleic Acids Res. 2021, doi: 10.1093/nar/gkab944 | Contact: Lukasz P. Kozlowski |
