Oleiphilus sp. HI0043
Taxonomy: cellular organisms; Bacteria; Proteobacteria; Gammaproteobacteria; Oceanospirillales; Oleiphilaceae; Oleiphilus; unclassified Oleiphilus
Average proteome isoelectric point is 6.0
Get precalculated fractions of proteins

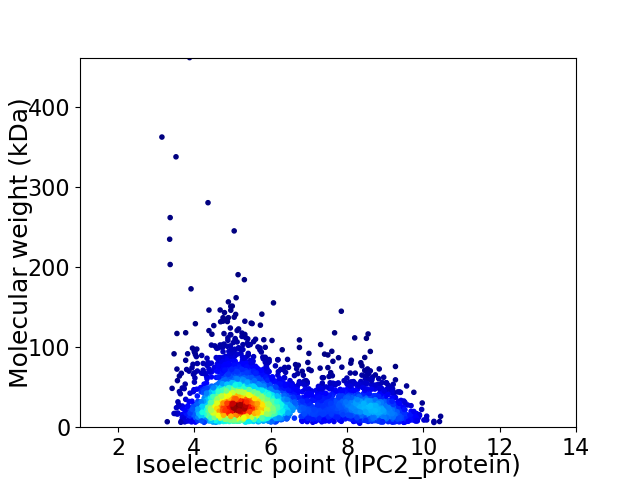
Virtual 2D-PAGE plot for 3862 proteins (isoelectric point calculated using IPC2_protein)
Get csv file with sequences according to given criteria:
* You can choose from 21 different methods for calculating isoelectric point
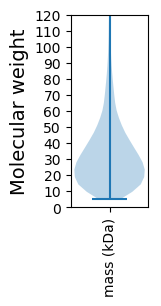
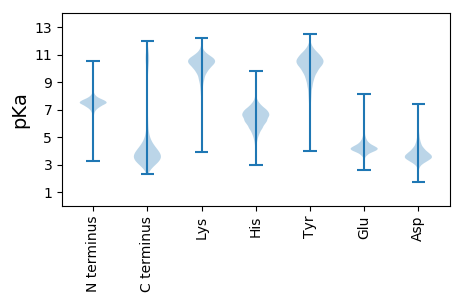
Summary statistics related to proteome-wise predictions


Protein with the lowest isoelectric point:
>tr|A0A657ALE5|A0A657ALE5_9GAMM Siroheme decarboxylase OS=Oleiphilus sp. HI0043 OX=1822233 GN=A3729_17415 PE=3 SV=1
MM1 pKa = 7.43KK2 pKa = 10.36KK3 pKa = 10.26IIALLLISAGLTGCGGVGSLVSNDD27 pKa = 3.24RR28 pKa = 11.84VTDD31 pKa = 3.73ADD33 pKa = 3.48NDD35 pKa = 3.87QVVTIGDD42 pKa = 4.11SIFALSGKK50 pKa = 9.38IQDD53 pKa = 3.78ILEE56 pKa = 4.67DD57 pKa = 3.77YY58 pKa = 10.88AGEE61 pKa = 4.22TFRR64 pKa = 11.84QYY66 pKa = 10.31TISGAEE72 pKa = 3.92VTGGIYY78 pKa = 9.61ATDD81 pKa = 3.22IATQFEE87 pKa = 4.38IAKK90 pKa = 9.76NDD92 pKa = 3.48NPNIQTIVMDD102 pKa = 4.27AAGNDD107 pKa = 3.18ILIPIITMFDD117 pKa = 3.1WYY119 pKa = 10.85NCKK122 pKa = 9.52TEE124 pKa = 3.99WYY126 pKa = 8.45QWWGLSSSCKK136 pKa = 10.49NLIDD140 pKa = 4.33DD141 pKa = 5.28LYY143 pKa = 11.06VDD145 pKa = 5.14VVNLLNNIDD154 pKa = 3.8ANGVEE159 pKa = 4.28NVIFLGYY166 pKa = 9.86YY167 pKa = 8.3YY168 pKa = 9.95PKK170 pKa = 10.72NALLWLDD177 pKa = 3.97DD178 pKa = 3.63VEE180 pKa = 4.45EE181 pKa = 4.23AVDD184 pKa = 3.74YY185 pKa = 11.54GDD187 pKa = 3.63MRR189 pKa = 11.84LAQACANSTANCTFIDD205 pKa = 4.05PRR207 pKa = 11.84SVINDD212 pKa = 3.28RR213 pKa = 11.84DD214 pKa = 3.77IIIDD218 pKa = 4.91GIHH221 pKa = 7.0PATSGSQKK229 pKa = 10.44LADD232 pKa = 5.42LIWPVLQPMLL242 pKa = 4.39
MM1 pKa = 7.43KK2 pKa = 10.36KK3 pKa = 10.26IIALLLISAGLTGCGGVGSLVSNDD27 pKa = 3.24RR28 pKa = 11.84VTDD31 pKa = 3.73ADD33 pKa = 3.48NDD35 pKa = 3.87QVVTIGDD42 pKa = 4.11SIFALSGKK50 pKa = 9.38IQDD53 pKa = 3.78ILEE56 pKa = 4.67DD57 pKa = 3.77YY58 pKa = 10.88AGEE61 pKa = 4.22TFRR64 pKa = 11.84QYY66 pKa = 10.31TISGAEE72 pKa = 3.92VTGGIYY78 pKa = 9.61ATDD81 pKa = 3.22IATQFEE87 pKa = 4.38IAKK90 pKa = 9.76NDD92 pKa = 3.48NPNIQTIVMDD102 pKa = 4.27AAGNDD107 pKa = 3.18ILIPIITMFDD117 pKa = 3.1WYY119 pKa = 10.85NCKK122 pKa = 9.52TEE124 pKa = 3.99WYY126 pKa = 8.45QWWGLSSSCKK136 pKa = 10.49NLIDD140 pKa = 4.33DD141 pKa = 5.28LYY143 pKa = 11.06VDD145 pKa = 5.14VVNLLNNIDD154 pKa = 3.8ANGVEE159 pKa = 4.28NVIFLGYY166 pKa = 9.86YY167 pKa = 8.3YY168 pKa = 9.95PKK170 pKa = 10.72NALLWLDD177 pKa = 3.97DD178 pKa = 3.63VEE180 pKa = 4.45EE181 pKa = 4.23AVDD184 pKa = 3.74YY185 pKa = 11.54GDD187 pKa = 3.63MRR189 pKa = 11.84LAQACANSTANCTFIDD205 pKa = 4.05PRR207 pKa = 11.84SVINDD212 pKa = 3.28RR213 pKa = 11.84DD214 pKa = 3.77IIIDD218 pKa = 4.91GIHH221 pKa = 7.0PATSGSQKK229 pKa = 10.44LADD232 pKa = 5.42LIWPVLQPMLL242 pKa = 4.39
Molecular weight: 26.58 kDa
Isoelectric point according different methods:
Protein with the highest isoelectric point:
>tr|A0A657AMG7|A0A657AMG7_9GAMM Uncharacterized protein OS=Oleiphilus sp. HI0043 OX=1822233 GN=A3729_10500 PE=4 SV=1
DDD2 pKa = 3.93QGNALSWATAGGSGFRR18 pKa = 11.84GSRR21 pKa = 11.84KKK23 pKa = 8.26TPFAAQVAAEEE34 pKa = 4.14AGNAAAEEE42 pKa = 4.17YY43 pKa = 10.13LKKK46 pKa = 10.41LEEE49 pKa = 4.27QVKKK53 pKa = 9.85PGPGRR58 pKa = 11.84EEE60 pKa = 4.07AVRR63 pKa = 11.84ALNACGYYY71 pKa = 9.79KK72 pKa = 8.73TNITDDD78 pKa = 3.31TPIPHHH84 pKa = 6.41GCRR87 pKa = 11.84PPKKK91 pKa = 9.7KK92 pKa = 10.01RR93 pKa = 11.84V
DDD2 pKa = 3.93QGNALSWATAGGSGFRR18 pKa = 11.84GSRR21 pKa = 11.84KKK23 pKa = 8.26TPFAAQVAAEEE34 pKa = 4.14AGNAAAEEE42 pKa = 4.17YY43 pKa = 10.13LKKK46 pKa = 10.41LEEE49 pKa = 4.27QVKKK53 pKa = 9.85PGPGRR58 pKa = 11.84EEE60 pKa = 4.07AVRR63 pKa = 11.84ALNACGYYY71 pKa = 9.79KK72 pKa = 8.73TNITDDD78 pKa = 3.31TPIPHHH84 pKa = 6.41GCRR87 pKa = 11.84PPKKK91 pKa = 9.7KK92 pKa = 10.01RR93 pKa = 11.84V
Molecular weight: 9.85 kDa
Isoelectric point according different methods:
Peptides (in silico digests for buttom-up proteomics)
Below you can find in silico digests of the whole proteome with Trypsin, Chymotrypsin, Trypsin+LysC, LysN, ArgC proteases suitable for different mass spec machines.| Try ESI |
 |
|---|
| ChTry ESI |
 |
|---|
| ArgC ESI |
 |
|---|
| LysN ESI |
 |
|---|
| TryLysC ESI |
 |
|---|
| Try MALDI |
 |
|---|
| ChTry MALDI |
 |
|---|
| ArgC MALDI |
 |
|---|
| LysN MALDI |
 |
|---|
| TryLysC MALDI |
 |
|---|
| Try LTQ |
 |
|---|
| ChTry LTQ |
 |
|---|
| ArgC LTQ |
 |
|---|
| LysN LTQ |
 |
|---|
| TryLysC LTQ |
 |
|---|
| Try MSlow |
 |
|---|
| ChTry MSlow |
 |
|---|
| ArgC MSlow |
 |
|---|
| LysN MSlow |
 |
|---|
| TryLysC MSlow |
 |
|---|
| Try MShigh |
 |
|---|
| ChTry MShigh |
 |
|---|
| ArgC MShigh |
 |
|---|
| LysN MShigh |
 |
|---|
| TryLysC MShigh |
 |
|---|
General Statistics
Number of major isoforms |
Number of additional isoforms |
Number of all proteins |
Number of amino acids |
Min. Seq. Length |
Max. Seq. Length |
Avg. Seq. Length |
Avg. Mol. Weight |
|---|---|---|---|---|---|---|---|
0 |
1195953 |
45 |
4321 |
309.7 |
34.38 |
Amino acid frequency
Ala |
Cys |
Asp |
Glu |
Phe |
Gly |
His |
Ile |
Lys |
Leu |
|---|---|---|---|---|---|---|---|---|---|
8.415 ± 0.034 | 1.053 ± 0.013 |
5.85 ± 0.055 | 6.906 ± 0.041 |
4.022 ± 0.028 | 6.751 ± 0.044 |
2.193 ± 0.022 | 6.372 ± 0.033 |
5.63 ± 0.047 | 10.53 ± 0.05 |
Met |
Asn |
Gln |
Pro |
Arg |
Ser |
Thr |
Val |
Trp |
Tyr |
|---|---|---|---|---|---|---|---|---|---|
2.42 ± 0.024 | 4.075 ± 0.03 |
3.827 ± 0.024 | 4.239 ± 0.028 |
4.568 ± 0.032 | 7.485 ± 0.044 |
4.932 ± 0.044 | 6.636 ± 0.035 |
1.097 ± 0.013 | 2.996 ± 0.023 |
Most of the basic statistics you can see at this page can be downloaded from this CSV file
Proteome-pI is available under Creative Commons Attribution-NoDerivs license, for more details see here
| Reference: Kozlowski LP. Proteome-pI 2.0: Proteome Isoelectric Point Database Update. Nucleic Acids Res. 2021, doi: 10.1093/nar/gkab944 | Contact: Lukasz P. Kozlowski |
