Archaeoglobus sulfaticallidus PM70-1
Taxonomy: cellular organisms; Archaea; Euryarchaeota; Archaeoglobi; Archaeoglobales; Archaeoglobaceae; Archaeoglobus; Archaeoglobus sulfaticallidus
Average proteome isoelectric point is 6.49
Get precalculated fractions of proteins

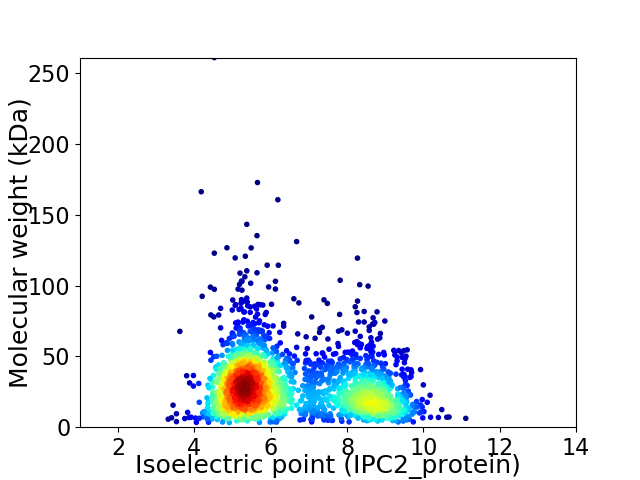
Virtual 2D-PAGE plot for 2213 proteins (isoelectric point calculated using IPC2_protein)
Get csv file with sequences according to given criteria:
* You can choose from 21 different methods for calculating isoelectric point
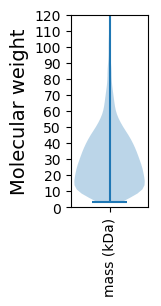
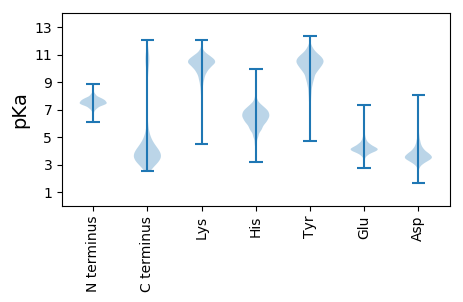
Summary statistics related to proteome-wise predictions


Protein with the lowest isoelectric point:
>tr|N0BGQ3|N0BGQ3_9EURY Ribosomal RNA small subunit methyltransferase Nep1 OS=Archaeoglobus sulfaticallidus PM70-1 OX=387631 GN=nep1 PE=3 SV=1
MM1 pKa = 7.48VDD3 pKa = 3.34VKK5 pKa = 10.31KK6 pKa = 10.73KK7 pKa = 10.59CVGAVLMVAVLLMASVLPALAATTGQSSGSFEE39 pKa = 5.0LGNEE43 pKa = 4.03APQVVSVNLLLEE55 pKa = 4.86DD56 pKa = 4.51EE57 pKa = 4.55NTDD60 pKa = 3.97ANNQMTPQTEE70 pKa = 4.11YY71 pKa = 11.04ALKK74 pKa = 10.36IVASDD79 pKa = 3.35ANGYY83 pKa = 10.79GDD85 pKa = 3.24ISKK88 pKa = 8.37ITVYY92 pKa = 10.0IYY94 pKa = 11.23YY95 pKa = 10.15DD96 pKa = 3.65ANGDD100 pKa = 3.78GADD103 pKa = 4.41EE104 pKa = 4.93PGSDD108 pKa = 4.29NPQTQATYY116 pKa = 9.96QWTSSGGWTFVGPAGSTWGIDD137 pKa = 3.22TAADD141 pKa = 3.5QSRR144 pKa = 11.84GPVSTTTTTGTWYY157 pKa = 10.78LHH159 pKa = 6.67FIPGKK164 pKa = 10.27VATQSDD170 pKa = 4.09EE171 pKa = 5.72DD172 pKa = 4.03DD173 pKa = 3.89SKK175 pKa = 11.19WIIKK179 pKa = 9.48VVVEE183 pKa = 4.9DD184 pKa = 4.54GNSASDD190 pKa = 4.04SMKK193 pKa = 10.58DD194 pKa = 3.34TDD196 pKa = 6.36NEE198 pKa = 4.26MQWYY202 pKa = 10.47GEE204 pKa = 4.02IQVDD208 pKa = 4.17DD209 pKa = 4.34GSFDD213 pKa = 3.62FGSVNLGSSDD223 pKa = 4.41NPITTPNDD231 pKa = 3.25HH232 pKa = 7.05NIDD235 pKa = 3.2ITTVSNGQHH244 pKa = 6.79KK245 pKa = 10.05IQAKK249 pKa = 9.06TDD251 pKa = 3.75AQWSSGGNNVNVNTVSEE268 pKa = 4.46SPGAGEE274 pKa = 3.58ITIEE278 pKa = 4.06HH279 pKa = 6.54FNANDD284 pKa = 3.38EE285 pKa = 4.15TSAAIVQTSYY295 pKa = 11.55TDD297 pKa = 3.54VQGLTSIGQTSEE309 pKa = 3.72TGTTSEE315 pKa = 3.71IYY317 pKa = 8.66MWLTVGSEE325 pKa = 4.55GIMSGTYY332 pKa = 8.63TGTYY336 pKa = 8.69YY337 pKa = 10.96VQIANAA343 pKa = 3.92
MM1 pKa = 7.48VDD3 pKa = 3.34VKK5 pKa = 10.31KK6 pKa = 10.73KK7 pKa = 10.59CVGAVLMVAVLLMASVLPALAATTGQSSGSFEE39 pKa = 5.0LGNEE43 pKa = 4.03APQVVSVNLLLEE55 pKa = 4.86DD56 pKa = 4.51EE57 pKa = 4.55NTDD60 pKa = 3.97ANNQMTPQTEE70 pKa = 4.11YY71 pKa = 11.04ALKK74 pKa = 10.36IVASDD79 pKa = 3.35ANGYY83 pKa = 10.79GDD85 pKa = 3.24ISKK88 pKa = 8.37ITVYY92 pKa = 10.0IYY94 pKa = 11.23YY95 pKa = 10.15DD96 pKa = 3.65ANGDD100 pKa = 3.78GADD103 pKa = 4.41EE104 pKa = 4.93PGSDD108 pKa = 4.29NPQTQATYY116 pKa = 9.96QWTSSGGWTFVGPAGSTWGIDD137 pKa = 3.22TAADD141 pKa = 3.5QSRR144 pKa = 11.84GPVSTTTTTGTWYY157 pKa = 10.78LHH159 pKa = 6.67FIPGKK164 pKa = 10.27VATQSDD170 pKa = 4.09EE171 pKa = 5.72DD172 pKa = 4.03DD173 pKa = 3.89SKK175 pKa = 11.19WIIKK179 pKa = 9.48VVVEE183 pKa = 4.9DD184 pKa = 4.54GNSASDD190 pKa = 4.04SMKK193 pKa = 10.58DD194 pKa = 3.34TDD196 pKa = 6.36NEE198 pKa = 4.26MQWYY202 pKa = 10.47GEE204 pKa = 4.02IQVDD208 pKa = 4.17DD209 pKa = 4.34GSFDD213 pKa = 3.62FGSVNLGSSDD223 pKa = 4.41NPITTPNDD231 pKa = 3.25HH232 pKa = 7.05NIDD235 pKa = 3.2ITTVSNGQHH244 pKa = 6.79KK245 pKa = 10.05IQAKK249 pKa = 9.06TDD251 pKa = 3.75AQWSSGGNNVNVNTVSEE268 pKa = 4.46SPGAGEE274 pKa = 3.58ITIEE278 pKa = 4.06HH279 pKa = 6.54FNANDD284 pKa = 3.38EE285 pKa = 4.15TSAAIVQTSYY295 pKa = 11.55TDD297 pKa = 3.54VQGLTSIGQTSEE309 pKa = 3.72TGTTSEE315 pKa = 3.71IYY317 pKa = 8.66MWLTVGSEE325 pKa = 4.55GIMSGTYY332 pKa = 8.63TGTYY336 pKa = 8.69YY337 pKa = 10.96VQIANAA343 pKa = 3.92
Molecular weight: 36.35 kDa
Isoelectric point according different methods:
Protein with the highest isoelectric point:
>tr|N0BB60|N0BB60_9EURY Uncharacterized protein OS=Archaeoglobus sulfaticallidus PM70-1 OX=387631 GN=Asulf_00204 PE=4 SV=1
MM1 pKa = 7.34GKK3 pKa = 8.34KK4 pKa = 8.25TVGVKK9 pKa = 10.04FRR11 pKa = 11.84LAKK14 pKa = 10.29FYY16 pKa = 10.43RR17 pKa = 11.84QNRR20 pKa = 11.84RR21 pKa = 11.84APLWVTLKK29 pKa = 9.3TKK31 pKa = 10.51RR32 pKa = 11.84RR33 pKa = 11.84VFSSPKK39 pKa = 7.81RR40 pKa = 11.84RR41 pKa = 11.84HH42 pKa = 4.06WRR44 pKa = 11.84RR45 pKa = 11.84KK46 pKa = 7.81KK47 pKa = 10.93LKK49 pKa = 9.64VV50 pKa = 3.14
MM1 pKa = 7.34GKK3 pKa = 8.34KK4 pKa = 8.25TVGVKK9 pKa = 10.04FRR11 pKa = 11.84LAKK14 pKa = 10.29FYY16 pKa = 10.43RR17 pKa = 11.84QNRR20 pKa = 11.84RR21 pKa = 11.84APLWVTLKK29 pKa = 9.3TKK31 pKa = 10.51RR32 pKa = 11.84RR33 pKa = 11.84VFSSPKK39 pKa = 7.81RR40 pKa = 11.84RR41 pKa = 11.84HH42 pKa = 4.06WRR44 pKa = 11.84RR45 pKa = 11.84KK46 pKa = 7.81KK47 pKa = 10.93LKK49 pKa = 9.64VV50 pKa = 3.14
Molecular weight: 6.23 kDa
Isoelectric point according different methods:
Peptides (in silico digests for buttom-up proteomics)
Below you can find in silico digests of the whole proteome with Trypsin, Chymotrypsin, Trypsin+LysC, LysN, ArgC proteases suitable for different mass spec machines.| Try ESI |
 |
|---|
| ChTry ESI |
 |
|---|
| ArgC ESI |
 |
|---|
| LysN ESI |
 |
|---|
| TryLysC ESI |
 |
|---|
| Try MALDI |
 |
|---|
| ChTry MALDI |
 |
|---|
| ArgC MALDI |
 |
|---|
| LysN MALDI |
 |
|---|
| TryLysC MALDI |
 |
|---|
| Try LTQ |
 |
|---|
| ChTry LTQ |
 |
|---|
| ArgC LTQ |
 |
|---|
| LysN LTQ |
 |
|---|
| TryLysC LTQ |
 |
|---|
| Try MSlow |
 |
|---|
| ChTry MSlow |
 |
|---|
| ArgC MSlow |
 |
|---|
| LysN MSlow |
 |
|---|
| TryLysC MSlow |
 |
|---|
| Try MShigh |
 |
|---|
| ChTry MShigh |
 |
|---|
| ArgC MShigh |
 |
|---|
| LysN MShigh |
 |
|---|
| TryLysC MShigh |
 |
|---|
General Statistics
Number of major isoforms |
Number of additional isoforms |
Number of all proteins |
Number of amino acids |
Min. Seq. Length |
Max. Seq. Length |
Avg. Seq. Length |
Avg. Mol. Weight |
|---|---|---|---|---|---|---|---|
0 |
604556 |
29 |
2362 |
273.2 |
30.86 |
Amino acid frequency
Ala |
Cys |
Asp |
Glu |
Phe |
Gly |
His |
Ile |
Lys |
Leu |
|---|---|---|---|---|---|---|---|---|---|
6.627 ± 0.056 | 1.119 ± 0.025 |
5.437 ± 0.041 | 8.474 ± 0.066 |
4.583 ± 0.037 | 6.853 ± 0.047 |
1.516 ± 0.021 | 8.694 ± 0.047 |
7.714 ± 0.056 | 9.24 ± 0.063 |
Met |
Asn |
Gln |
Pro |
Arg |
Ser |
Thr |
Val |
Trp |
Tyr |
|---|---|---|---|---|---|---|---|---|---|
2.61 ± 0.023 | 3.73 ± 0.042 |
3.617 ± 0.03 | 1.711 ± 0.02 |
5.407 ± 0.05 | 5.86 ± 0.038 |
4.261 ± 0.042 | 7.819 ± 0.046 |
0.975 ± 0.021 | 3.756 ± 0.04 |
Most of the basic statistics you can see at this page can be downloaded from this CSV file
Proteome-pI is available under Creative Commons Attribution-NoDerivs license, for more details see here
| Reference: Kozlowski LP. Proteome-pI 2.0: Proteome Isoelectric Point Database Update. Nucleic Acids Res. 2021, doi: 10.1093/nar/gkab944 | Contact: Lukasz P. Kozlowski |
