Fibrisoma limi BUZ 3
Taxonomy: cellular organisms; Bacteria; FCB group; Bacteroidetes/Chlorobi group; Bacteroidetes; Cytophagia; Cytophagales; Cytophagaceae; Fibrisoma; Fibrisoma limi
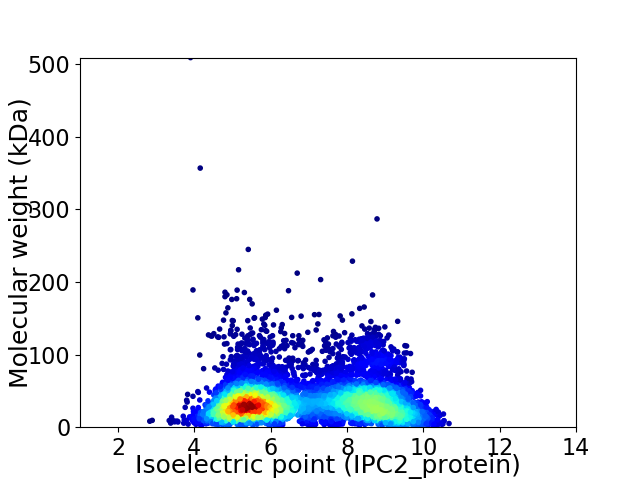
Average proteome isoelectric point is 6.88
Get precalculated fractions of proteins

Virtual 2D-PAGE plot for 6341 proteins (isoelectric point calculated using IPC2_protein)
Get csv file with sequences according to given criteria:
* You can choose from 21 different methods for calculating isoelectric point
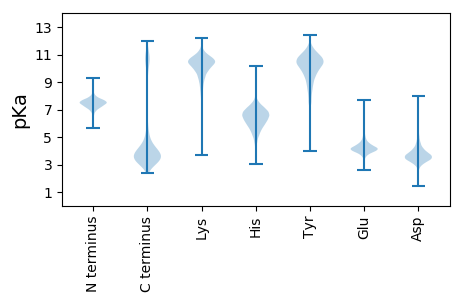
Summary statistics related to proteome-wise predictions


Protein with the lowest isoelectric point:
>tr|I2GCC2|I2GCC2_9BACT Response regulator receiver protein OS=Fibrisoma limi BUZ 3 OX=1185876 GN=BN8_00475 PE=4 SV=1
MM1 pKa = 7.65SVLRR5 pKa = 11.84CIAIDD10 pKa = 4.01DD11 pKa = 4.13EE12 pKa = 4.71PFALEE17 pKa = 4.66IIADD21 pKa = 4.33NISQVPFLHH30 pKa = 6.87LVGTFSNPYY39 pKa = 9.61DD40 pKa = 3.98ALDD43 pKa = 3.71VLSSGQVDD51 pKa = 3.63ILFLDD56 pKa = 3.37IQMPMLTGVQFLRR69 pKa = 11.84SFPQQTPVILTTAYY83 pKa = 9.45EE84 pKa = 4.28QYY86 pKa = 11.39ALEE89 pKa = 4.22
MM1 pKa = 7.65SVLRR5 pKa = 11.84CIAIDD10 pKa = 4.01DD11 pKa = 4.13EE12 pKa = 4.71PFALEE17 pKa = 4.66IIADD21 pKa = 4.33NISQVPFLHH30 pKa = 6.87LVGTFSNPYY39 pKa = 9.61DD40 pKa = 3.98ALDD43 pKa = 3.71VLSSGQVDD51 pKa = 3.63ILFLDD56 pKa = 3.37IQMPMLTGVQFLRR69 pKa = 11.84SFPQQTPVILTTAYY83 pKa = 9.45EE84 pKa = 4.28QYY86 pKa = 11.39ALEE89 pKa = 4.22
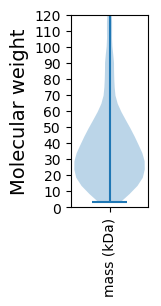
Molecular weight: 9.95 kDa
Isoelectric point according different methods:
Protein with the highest isoelectric point:
>tr|I2GBR3|I2GBR3_9BACT Uncharacterized protein OS=Fibrisoma limi BUZ 3 OX=1185876 GN=BN8_00255 PE=4 SV=1
MM1 pKa = 6.96RR2 pKa = 11.84TIVALLLLCTGCARR16 pKa = 11.84QPTLPADD23 pKa = 3.47SRR25 pKa = 11.84HH26 pKa = 5.54NVVGMLSDD34 pKa = 3.8STWFATGKK42 pKa = 10.38ALRR45 pKa = 11.84LVKK48 pKa = 10.45RR49 pKa = 11.84SEE51 pKa = 4.14APTSVRR57 pKa = 11.84QFNLQITTDD66 pKa = 3.62LGYY69 pKa = 10.06PGNTSANRR77 pKa = 11.84SPIVTGCNGDD87 pKa = 3.74CVPTQRR93 pKa = 11.84LHH95 pKa = 7.29LYY97 pKa = 7.62TIPLRR102 pKa = 11.84KK103 pKa = 9.91GKK105 pKa = 10.41FKK107 pKa = 10.86LSKK110 pKa = 9.2LDD112 pKa = 3.21KK113 pKa = 10.63RR114 pKa = 11.84RR115 pKa = 11.84VVDD118 pKa = 5.29DD119 pKa = 3.64EE120 pKa = 4.27RR121 pKa = 11.84TNYY124 pKa = 8.92WLLINGGGVVKK135 pKa = 10.6NYY137 pKa = 10.04RR138 pKa = 11.84FGGRR142 pKa = 11.84RR143 pKa = 11.84HH144 pKa = 4.51GWVRR148 pKa = 11.84ITRR151 pKa = 11.84YY152 pKa = 9.93DD153 pKa = 3.39RR154 pKa = 11.84QSNVIEE160 pKa = 4.3GRR162 pKa = 11.84FSFDD166 pKa = 3.69LDD168 pKa = 3.71EE169 pKa = 5.0NLNQVGRR176 pKa = 11.84RR177 pKa = 11.84LNSLPSVARR186 pKa = 11.84FRR188 pKa = 11.84DD189 pKa = 3.59GLFRR193 pKa = 11.84IPLEE197 pKa = 4.39DD198 pKa = 3.43VTLKK202 pKa = 10.93DD203 pKa = 3.3
MM1 pKa = 6.96RR2 pKa = 11.84TIVALLLLCTGCARR16 pKa = 11.84QPTLPADD23 pKa = 3.47SRR25 pKa = 11.84HH26 pKa = 5.54NVVGMLSDD34 pKa = 3.8STWFATGKK42 pKa = 10.38ALRR45 pKa = 11.84LVKK48 pKa = 10.45RR49 pKa = 11.84SEE51 pKa = 4.14APTSVRR57 pKa = 11.84QFNLQITTDD66 pKa = 3.62LGYY69 pKa = 10.06PGNTSANRR77 pKa = 11.84SPIVTGCNGDD87 pKa = 3.74CVPTQRR93 pKa = 11.84LHH95 pKa = 7.29LYY97 pKa = 7.62TIPLRR102 pKa = 11.84KK103 pKa = 9.91GKK105 pKa = 10.41FKK107 pKa = 10.86LSKK110 pKa = 9.2LDD112 pKa = 3.21KK113 pKa = 10.63RR114 pKa = 11.84RR115 pKa = 11.84VVDD118 pKa = 5.29DD119 pKa = 3.64EE120 pKa = 4.27RR121 pKa = 11.84TNYY124 pKa = 8.92WLLINGGGVVKK135 pKa = 10.6NYY137 pKa = 10.04RR138 pKa = 11.84FGGRR142 pKa = 11.84RR143 pKa = 11.84HH144 pKa = 4.51GWVRR148 pKa = 11.84ITRR151 pKa = 11.84YY152 pKa = 9.93DD153 pKa = 3.39RR154 pKa = 11.84QSNVIEE160 pKa = 4.3GRR162 pKa = 11.84FSFDD166 pKa = 3.69LDD168 pKa = 3.71EE169 pKa = 5.0NLNQVGRR176 pKa = 11.84RR177 pKa = 11.84LNSLPSVARR186 pKa = 11.84FRR188 pKa = 11.84DD189 pKa = 3.59GLFRR193 pKa = 11.84IPLEE197 pKa = 4.39DD198 pKa = 3.43VTLKK202 pKa = 10.93DD203 pKa = 3.3
Molecular weight: 23.02 kDa
Isoelectric point according different methods:
Peptides (in silico digests for buttom-up proteomics)
Below you can find in silico digests of the whole proteome with Trypsin, Chymotrypsin, Trypsin+LysC, LysN, ArgC proteases suitable for different mass spec machines.| Try ESI |
 |
|---|
| ChTry ESI |
 |
|---|
| ArgC ESI |
 |
|---|
| LysN ESI |
 |
|---|
| TryLysC ESI |
 |
|---|
| Try MALDI |
 |
|---|
| ChTry MALDI |
 |
|---|
| ArgC MALDI |
 |
|---|
| LysN MALDI |
 |
|---|
| TryLysC MALDI |
 |
|---|
| Try LTQ |
 |
|---|
| ChTry LTQ |
 |
|---|
| ArgC LTQ |
 |
|---|
| LysN LTQ |
 |
|---|
| TryLysC LTQ |
 |
|---|
| Try MSlow |
 |
|---|
| ChTry MSlow |
 |
|---|
| ArgC MSlow |
 |
|---|
| LysN MSlow |
 |
|---|
| TryLysC MSlow |
 |
|---|
| Try MShigh |
 |
|---|
| ChTry MShigh |
 |
|---|
| ArgC MShigh |
 |
|---|
| LysN MShigh |
 |
|---|
| TryLysC MShigh |
 |
|---|
General Statistics
Number of major isoforms |
Number of additional isoforms |
Number of all proteins |
Number of amino acids |
Min. Seq. Length |
Max. Seq. Length |
Avg. Seq. Length |
Avg. Mol. Weight |
|---|---|---|---|---|---|---|---|
0 |
2247638 |
30 |
5101 |
354.5 |
39.54 |
Amino acid frequency
Ala |
Cys |
Asp |
Glu |
Phe |
Gly |
His |
Ile |
Lys |
Leu |
|---|---|---|---|---|---|---|---|---|---|
8.355 ± 0.03 | 0.733 ± 0.009 |
5.339 ± 0.025 | 5.18 ± 0.029 |
4.433 ± 0.021 | 7.234 ± 0.035 |
1.823 ± 0.016 | 5.572 ± 0.026 |
4.534 ± 0.025 | 10.11 ± 0.04 |
Met |
Asn |
Gln |
Pro |
Arg |
Ser |
Thr |
Val |
Trp |
Tyr |
|---|---|---|---|---|---|---|---|---|---|
2.059 ± 0.013 | 4.631 ± 0.027 |
4.763 ± 0.019 | 4.626 ± 0.02 |
5.874 ± 0.026 | 5.975 ± 0.023 |
6.512 ± 0.049 | 7.095 ± 0.023 |
1.346 ± 0.011 | 3.805 ± 0.018 |
Most of the basic statistics you can see at this page can be downloaded from this CSV file
Proteome-pI is available under Creative Commons Attribution-NoDerivs license, for more details see here
| Reference: Kozlowski LP. Proteome-pI 2.0: Proteome Isoelectric Point Database Update. Nucleic Acids Res. 2021, doi: 10.1093/nar/gkab944 | Contact: Lukasz P. Kozlowski |
