Spiroplasma gladiatoris
Taxonomy: cellular organisms; Bacteria; Terrabacteria group; Tenericutes; Mollicutes; Entomoplasmatales; Spiroplasmataceae; Spiroplasma
Average proteome isoelectric point is 7.14
Get precalculated fractions of proteins
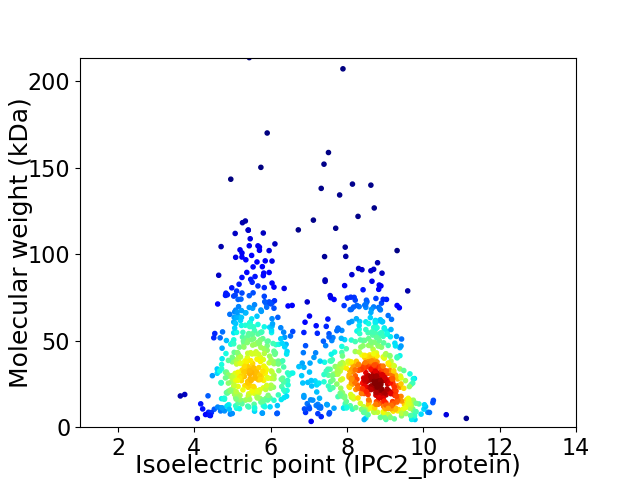
Virtual 2D-PAGE plot for 1024 proteins (isoelectric point calculated using IPC2_protein)
Get csv file with sequences according to given criteria:
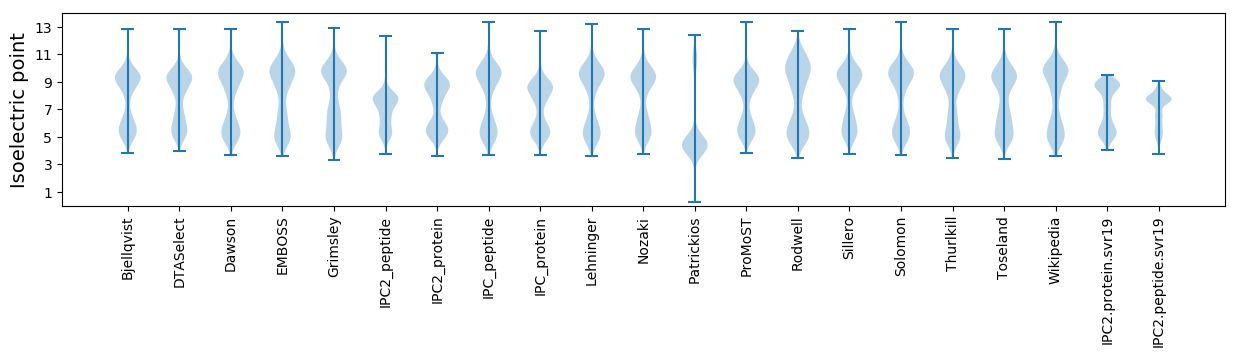
* You can choose from 21 different methods for calculating isoelectric point
Summary statistics related to proteome-wise predictions
Protein with the lowest isoelectric point:
>tr|A0A4P7AI28|A0A4P7AI28_9MOLU 30S ribosomal protein S11 OS=Spiroplasma gladiatoris OX=2143 GN=rpsK PE=3 SV=1
MM1 pKa = 6.41YY2 pKa = 9.25TSLEE6 pKa = 4.16AKK8 pKa = 10.12NLEE11 pKa = 3.79NTYY14 pKa = 10.28ISEE17 pKa = 4.19INFDD21 pKa = 3.92YY22 pKa = 10.79SAKK25 pKa = 9.7GWKK28 pKa = 9.26ISYY31 pKa = 10.95KK32 pKa = 10.97LMIDD36 pKa = 3.63LNGNNTYY43 pKa = 11.0DD44 pKa = 3.75EE45 pKa = 4.41NEE47 pKa = 4.14KK48 pKa = 11.18SNEE51 pKa = 4.11SEE53 pKa = 4.13NSGLEE58 pKa = 4.09YY59 pKa = 10.97
MM1 pKa = 6.41YY2 pKa = 9.25TSLEE6 pKa = 4.16AKK8 pKa = 10.12NLEE11 pKa = 3.79NTYY14 pKa = 10.28ISEE17 pKa = 4.19INFDD21 pKa = 3.92YY22 pKa = 10.79SAKK25 pKa = 9.7GWKK28 pKa = 9.26ISYY31 pKa = 10.95KK32 pKa = 10.97LMIDD36 pKa = 3.63LNGNNTYY43 pKa = 11.0DD44 pKa = 3.75EE45 pKa = 4.41NEE47 pKa = 4.14KK48 pKa = 11.18SNEE51 pKa = 4.11SEE53 pKa = 4.13NSGLEE58 pKa = 4.09YY59 pKa = 10.97
Molecular weight: 6.88 kDa
Isoelectric point according different methods:
Protein with the highest isoelectric point:
>tr|A0A4P7AIF0|A0A4P7AIF0_9MOLU 50S ribosomal protein L32 OS=Spiroplasma gladiatoris OX=2143 GN=rpmF PE=3 SV=1
MM1 pKa = 7.32KK2 pKa = 9.47RR3 pKa = 11.84TWQPSKK9 pKa = 10.03IKK11 pKa = 10.14HH12 pKa = 5.53ARR14 pKa = 11.84THH16 pKa = 5.78GFRR19 pKa = 11.84ARR21 pKa = 11.84MATKK25 pKa = 10.41NGRR28 pKa = 11.84KK29 pKa = 9.2VIKK32 pKa = 10.14ARR34 pKa = 11.84RR35 pKa = 11.84AKK37 pKa = 10.34GRR39 pKa = 11.84AKK41 pKa = 10.69LSAA44 pKa = 3.92
MM1 pKa = 7.32KK2 pKa = 9.47RR3 pKa = 11.84TWQPSKK9 pKa = 10.03IKK11 pKa = 10.14HH12 pKa = 5.53ARR14 pKa = 11.84THH16 pKa = 5.78GFRR19 pKa = 11.84ARR21 pKa = 11.84MATKK25 pKa = 10.41NGRR28 pKa = 11.84KK29 pKa = 9.2VIKK32 pKa = 10.14ARR34 pKa = 11.84RR35 pKa = 11.84AKK37 pKa = 10.34GRR39 pKa = 11.84AKK41 pKa = 10.69LSAA44 pKa = 3.92
Molecular weight: 5.09 kDa
Isoelectric point according different methods:
Peptides (in silico digests for buttom-up proteomics)
Below you can find in silico digests of the whole proteome with Trypsin, Chymotrypsin, Trypsin+LysC, LysN, ArgC proteases suitable for different mass spec machines.| Try ESI |
 |
|---|
| ChTry ESI |
|
|---|
| ArgC ESI |
|
|---|
| LysN ESI |
|
|---|
| TryLysC ESI |
|
|---|
| Try MALDI |
|
|---|
| ChTry MALDI |
|
|---|
| ArgC MALDI |
|
|---|
| LysN MALDI |
|
|---|
| TryLysC MALDI |
|
|---|
| Try LTQ |
|
|---|
| ChTry LTQ |
|
|---|
| ArgC LTQ |
|
|---|
| LysN LTQ |
|
|---|
| TryLysC LTQ |
|
|---|
| Try MSlow |
|
|---|
| ChTry MSlow |
|
|---|
| ArgC MSlow |
|
|---|
| LysN MSlow |
|
|---|
| TryLysC MSlow |
|
|---|
| Try MShigh |
|
|---|
| ChTry MShigh |
|
|---|
| ArgC MShigh |
|
|---|
| LysN MShigh |
|
|---|
| TryLysC MShigh |
|
|---|
General Statistics
Number of major isoforms |
Number of additional isoforms |
Number of all proteins |
Number of amino acids |
Min. Seq. Length |
Max. Seq. Length |
Avg. Seq. Length |
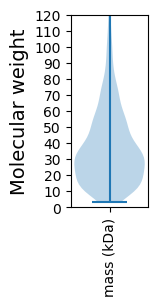
Avg. Mol. Weight |
|---|---|---|---|---|---|---|---|
0 |
345192 |
32 |
1878 |
337.1 |
38.69 |
Amino acid frequency
Ala |
Cys |
Asp |
Glu |
Phe |
Gly |
His |
Ile |
Lys |
Leu |
|---|---|---|---|---|---|---|---|---|---|
4.758 ± 0.083 | 0.749 ± 0.022 |
5.474 ± 0.064 | 6.854 ± 0.082 |
5.442 ± 0.065 | 4.82 ± 0.072 |
1.198 ± 0.032 | 10.076 ± 0.085 |
10.525 ± 0.089 | 9.429 ± 0.073 |
Met |
Asn |
Gln |
Pro |
Arg |
Ser |
Thr |
Val |
Trp |
Tyr |
|---|---|---|---|---|---|---|---|---|---|
2.036 ± 0.032 | 8.057 ± 0.097 |
2.36 ± 0.036 | 3.006 ± 0.044 |
2.656 ± 0.039 | 6.601 ± 0.068 |
4.929 ± 0.045 | 5.721 ± 0.058 |
0.938 ± 0.025 | 4.373 ± 0.056 |
Most of the basic statistics you can see at this page can be downloaded from this CSV file
See this proteome in:

Proteome-pI is available under Creative Commons Attribution-NoDerivs license, for more details see here
| Reference: Kozlowski LP. Proteome-pI 2.0: Proteome Isoelectric Point Database Update. Nucleic Acids Res. 2021, doi: 10.1093/nar/gkab944 | Contact: Lukasz P. Kozlowski |