Fulvimarina pelagi HTCC2506
Taxonomy: cellular organisms; Bacteria; Proteobacteria; Alphaproteobacteria; Hyphomicrobiales; Aurantimonadaceae; Fulvimarina; Fulvimarina pelagi
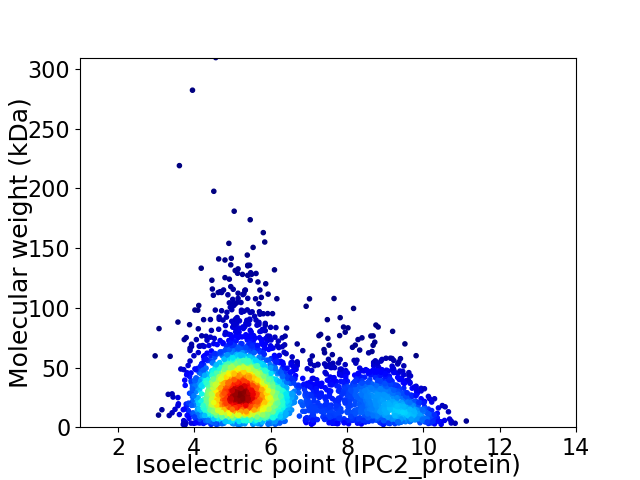
Average proteome isoelectric point is 6.16
Get precalculated fractions of proteins

Virtual 2D-PAGE plot for 3739 proteins (isoelectric point calculated using IPC2_protein)
Get csv file with sequences according to given criteria:
* You can choose from 21 different methods for calculating isoelectric point
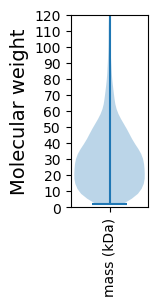
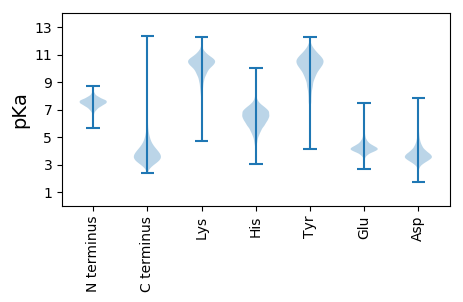
Summary statistics related to proteome-wise predictions


Protein with the lowest isoelectric point:
>tr|Q0G5I4|Q0G5I4_9RHIZ Proline-rich region:ATP/GTP-binding site motif A (P-loop) OS=Fulvimarina pelagi HTCC2506 OX=314231 GN=FP2506_09561 PE=4 SV=1
MM1 pKa = 7.68KK2 pKa = 10.59KK3 pKa = 8.95LTLSALASVALLAAPALAQDD23 pKa = 4.51DD24 pKa = 4.07QTSAEE29 pKa = 4.18TTAAASEE36 pKa = 4.22DD37 pKa = 3.94TAGGDD42 pKa = 3.64MQPMEE47 pKa = 4.55VTMNAPDD54 pKa = 3.93GSDD57 pKa = 2.99RR58 pKa = 11.84GTVTVTPTPNGLLLEE73 pKa = 4.67AEE75 pKa = 4.42LTGLEE80 pKa = 4.17PGEE83 pKa = 4.53HH84 pKa = 6.62GFHH87 pKa = 6.39IHH89 pKa = 5.81EE90 pKa = 4.73TGQCGEE96 pKa = 4.71DD97 pKa = 4.16FSAAGGHH104 pKa = 5.68YY105 pKa = 10.39NPTDD109 pKa = 3.52MEE111 pKa = 4.58HH112 pKa = 8.29GYY114 pKa = 7.81MTEE117 pKa = 4.61GGPHH121 pKa = 6.83AGDD124 pKa = 3.56MPNFTAGEE132 pKa = 4.34DD133 pKa = 3.88GSATFAVFNPNLTVSDD149 pKa = 3.47GDD151 pKa = 4.06APVMDD156 pKa = 5.94DD157 pKa = 4.34DD158 pKa = 5.15GSAIMVHH165 pKa = 6.45GGADD169 pKa = 3.61DD170 pKa = 4.75YY171 pKa = 11.58EE172 pKa = 4.39SQPAGDD178 pKa = 3.72AGDD181 pKa = 4.07RR182 pKa = 11.84VACGVIGGAEE192 pKa = 3.68
MM1 pKa = 7.68KK2 pKa = 10.59KK3 pKa = 8.95LTLSALASVALLAAPALAQDD23 pKa = 4.51DD24 pKa = 4.07QTSAEE29 pKa = 4.18TTAAASEE36 pKa = 4.22DD37 pKa = 3.94TAGGDD42 pKa = 3.64MQPMEE47 pKa = 4.55VTMNAPDD54 pKa = 3.93GSDD57 pKa = 2.99RR58 pKa = 11.84GTVTVTPTPNGLLLEE73 pKa = 4.67AEE75 pKa = 4.42LTGLEE80 pKa = 4.17PGEE83 pKa = 4.53HH84 pKa = 6.62GFHH87 pKa = 6.39IHH89 pKa = 5.81EE90 pKa = 4.73TGQCGEE96 pKa = 4.71DD97 pKa = 4.16FSAAGGHH104 pKa = 5.68YY105 pKa = 10.39NPTDD109 pKa = 3.52MEE111 pKa = 4.58HH112 pKa = 8.29GYY114 pKa = 7.81MTEE117 pKa = 4.61GGPHH121 pKa = 6.83AGDD124 pKa = 3.56MPNFTAGEE132 pKa = 4.34DD133 pKa = 3.88GSATFAVFNPNLTVSDD149 pKa = 3.47GDD151 pKa = 4.06APVMDD156 pKa = 5.94DD157 pKa = 4.34DD158 pKa = 5.15GSAIMVHH165 pKa = 6.45GGADD169 pKa = 3.61DD170 pKa = 4.75YY171 pKa = 11.58EE172 pKa = 4.39SQPAGDD178 pKa = 3.72AGDD181 pKa = 4.07RR182 pKa = 11.84VACGVIGGAEE192 pKa = 3.68
Molecular weight: 19.38 kDa
Isoelectric point according different methods:
Protein with the highest isoelectric point:
>tr|Q0G1A7|Q0G1A7_9RHIZ Uncharacterized protein OS=Fulvimarina pelagi HTCC2506 OX=314231 GN=FP2506_12944 PE=3 SV=1
MM1 pKa = 7.35KK2 pKa = 9.43RR3 pKa = 11.84TYY5 pKa = 10.27QPSKK9 pKa = 9.73LVRR12 pKa = 11.84KK13 pKa = 8.95RR14 pKa = 11.84RR15 pKa = 11.84HH16 pKa = 4.63GFRR19 pKa = 11.84SRR21 pKa = 11.84MATVGGRR28 pKa = 11.84KK29 pKa = 9.29VIASRR34 pKa = 11.84RR35 pKa = 11.84SKK37 pKa = 10.32GRR39 pKa = 11.84KK40 pKa = 8.78RR41 pKa = 11.84LSAA44 pKa = 3.96
MM1 pKa = 7.35KK2 pKa = 9.43RR3 pKa = 11.84TYY5 pKa = 10.27QPSKK9 pKa = 9.73LVRR12 pKa = 11.84KK13 pKa = 8.95RR14 pKa = 11.84RR15 pKa = 11.84HH16 pKa = 4.63GFRR19 pKa = 11.84SRR21 pKa = 11.84MATVGGRR28 pKa = 11.84KK29 pKa = 9.29VIASRR34 pKa = 11.84RR35 pKa = 11.84SKK37 pKa = 10.32GRR39 pKa = 11.84KK40 pKa = 8.78RR41 pKa = 11.84LSAA44 pKa = 3.96
Molecular weight: 5.16 kDa
Isoelectric point according different methods:
Peptides (in silico digests for buttom-up proteomics)
Below you can find in silico digests of the whole proteome with Trypsin, Chymotrypsin, Trypsin+LysC, LysN, ArgC proteases suitable for different mass spec machines.| Try ESI |
 |
|---|
| ChTry ESI |
 |
|---|
| ArgC ESI |
 |
|---|
| LysN ESI |
 |
|---|
| TryLysC ESI |
 |
|---|
| Try MALDI |
 |
|---|
| ChTry MALDI |
 |
|---|
| ArgC MALDI |
 |
|---|
| LysN MALDI |
 |
|---|
| TryLysC MALDI |
 |
|---|
| Try LTQ |
 |
|---|
| ChTry LTQ |
 |
|---|
| ArgC LTQ |
 |
|---|
| LysN LTQ |
 |
|---|
| TryLysC LTQ |
 |
|---|
| Try MSlow |
 |
|---|
| ChTry MSlow |
 |
|---|
| ArgC MSlow |
 |
|---|
| LysN MSlow |
 |
|---|
| TryLysC MSlow |
 |
|---|
| Try MShigh |
 |
|---|
| ChTry MShigh |
 |
|---|
| ArgC MShigh |
 |
|---|
| LysN MShigh |
 |
|---|
| TryLysC MShigh |
 |
|---|
General Statistics
Number of major isoforms |
Number of additional isoforms |
Number of all proteins |
Number of amino acids |
Min. Seq. Length |
Max. Seq. Length |
Avg. Seq. Length |
Avg. Mol. Weight |
|---|---|---|---|---|---|---|---|
0 |
1100244 |
20 |
2839 |
294.3 |
32.02 |
Amino acid frequency
Ala |
Cys |
Asp |
Glu |
Phe |
Gly |
His |
Ile |
Lys |
Leu |
|---|---|---|---|---|---|---|---|---|---|
11.667 ± 0.047 | 0.809 ± 0.013 |
6.036 ± 0.038 | 6.649 ± 0.04 |
3.95 ± 0.032 | 8.586 ± 0.042 |
1.881 ± 0.018 | 5.493 ± 0.029 |
3.405 ± 0.036 | 9.601 ± 0.05 |
Met |
Asn |
Gln |
Pro |
Arg |
Ser |
Thr |
Val |
Trp |
Tyr |
|---|---|---|---|---|---|---|---|---|---|
2.517 ± 0.02 | 2.691 ± 0.023 |
4.876 ± 0.031 | 2.854 ± 0.027 |
7.008 ± 0.042 | 5.888 ± 0.04 |
5.467 ± 0.027 | 7.229 ± 0.033 |
1.196 ± 0.016 | 2.195 ± 0.022 |
Most of the basic statistics you can see at this page can be downloaded from this CSV file
Proteome-pI is available under Creative Commons Attribution-NoDerivs license, for more details see here
| Reference: Kozlowski LP. Proteome-pI 2.0: Proteome Isoelectric Point Database Update. Nucleic Acids Res. 2021, doi: 10.1093/nar/gkab944 | Contact: Lukasz P. Kozlowski |
