Fulvimarina endophytica
Taxonomy: cellular organisms; Bacteria; Proteobacteria; Alphaproteobacteria; Hyphomicrobiales; Aurantimonadaceae; Fulvimarina
Average proteome isoelectric point is 6.15
Get precalculated fractions of proteins

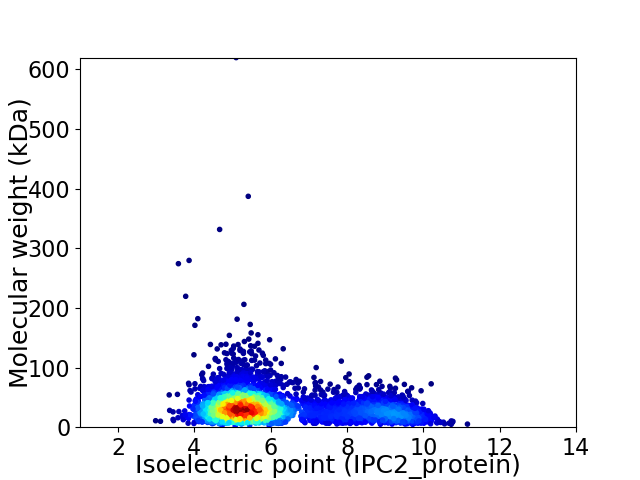
Virtual 2D-PAGE plot for 3833 proteins (isoelectric point calculated using IPC2_protein)
Get csv file with sequences according to given criteria:
* You can choose from 21 different methods for calculating isoelectric point
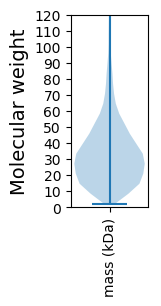
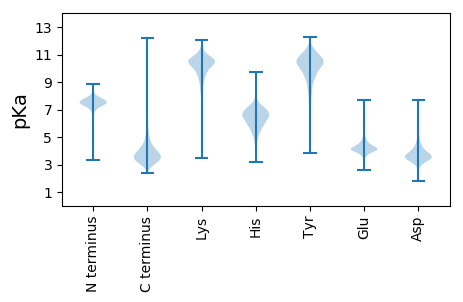
Summary statistics related to proteome-wise predictions


Protein with the lowest isoelectric point:
>tr|A0A371X1R6|A0A371X1R6_9RHIZ Uncharacterized protein OS=Fulvimarina endophytica OX=2293836 GN=DYI37_13440 PE=4 SV=1
MM1 pKa = 7.9RR2 pKa = 11.84LNLTASLAAIVLAGAMPAAAQDD24 pKa = 3.58VYY26 pKa = 11.58APYY29 pKa = 9.88EE30 pKa = 4.22PNPAPPVAAAYY41 pKa = 9.99DD42 pKa = 3.72YY43 pKa = 11.61GDD45 pKa = 3.31TDD47 pKa = 4.25FVFEE51 pKa = 4.79LGIGVAAQPDD61 pKa = 4.19YY62 pKa = 11.24LGSDD66 pKa = 3.33NYY68 pKa = 9.64MASIYY73 pKa = 10.76GFGSVEE79 pKa = 3.93YY80 pKa = 10.93LNIPGLGAFGGRR92 pKa = 11.84DD93 pKa = 3.29GRR95 pKa = 11.84GFSIGPSFNYY105 pKa = 10.06VGEE108 pKa = 4.21RR109 pKa = 11.84DD110 pKa = 3.97SNDD113 pKa = 3.07LAGIDD118 pKa = 4.33GVDD121 pKa = 3.09ATYY124 pKa = 11.08EE125 pKa = 3.88LGLRR129 pKa = 11.84AGYY132 pKa = 9.65EE133 pKa = 3.64WDD135 pKa = 3.35NAEE138 pKa = 3.96VYY140 pKa = 10.34GALRR144 pKa = 11.84YY145 pKa = 10.07GLGGAEE151 pKa = 4.57GLTGDD156 pKa = 4.41IGANLIARR164 pKa = 11.84PTDD167 pKa = 3.41RR168 pKa = 11.84LRR170 pKa = 11.84LKK172 pKa = 10.18AGPVATFADD181 pKa = 3.7ADD183 pKa = 3.91YY184 pKa = 10.89NDD186 pKa = 4.91AYY188 pKa = 10.92FSVSPRR194 pKa = 11.84EE195 pKa = 4.05FVNSGGRR202 pKa = 11.84FAAYY206 pKa = 9.77DD207 pKa = 3.26AGGGFNSVGIHH218 pKa = 5.69GEE220 pKa = 3.44ARR222 pKa = 11.84YY223 pKa = 9.76EE224 pKa = 3.82IFTDD228 pKa = 3.64YY229 pKa = 10.62FVNLDD234 pKa = 3.68ASWNRR239 pKa = 11.84LVGDD243 pKa = 4.67AGDD246 pKa = 3.92SPIVKK251 pKa = 9.96VAGDD255 pKa = 3.64DD256 pKa = 3.48DD257 pKa = 3.89QYY259 pKa = 11.69YY260 pKa = 10.34IGLGVSKK267 pKa = 10.56RR268 pKa = 11.84FSLDD272 pKa = 3.03LFF274 pKa = 4.45
MM1 pKa = 7.9RR2 pKa = 11.84LNLTASLAAIVLAGAMPAAAQDD24 pKa = 3.58VYY26 pKa = 11.58APYY29 pKa = 9.88EE30 pKa = 4.22PNPAPPVAAAYY41 pKa = 9.99DD42 pKa = 3.72YY43 pKa = 11.61GDD45 pKa = 3.31TDD47 pKa = 4.25FVFEE51 pKa = 4.79LGIGVAAQPDD61 pKa = 4.19YY62 pKa = 11.24LGSDD66 pKa = 3.33NYY68 pKa = 9.64MASIYY73 pKa = 10.76GFGSVEE79 pKa = 3.93YY80 pKa = 10.93LNIPGLGAFGGRR92 pKa = 11.84DD93 pKa = 3.29GRR95 pKa = 11.84GFSIGPSFNYY105 pKa = 10.06VGEE108 pKa = 4.21RR109 pKa = 11.84DD110 pKa = 3.97SNDD113 pKa = 3.07LAGIDD118 pKa = 4.33GVDD121 pKa = 3.09ATYY124 pKa = 11.08EE125 pKa = 3.88LGLRR129 pKa = 11.84AGYY132 pKa = 9.65EE133 pKa = 3.64WDD135 pKa = 3.35NAEE138 pKa = 3.96VYY140 pKa = 10.34GALRR144 pKa = 11.84YY145 pKa = 10.07GLGGAEE151 pKa = 4.57GLTGDD156 pKa = 4.41IGANLIARR164 pKa = 11.84PTDD167 pKa = 3.41RR168 pKa = 11.84LRR170 pKa = 11.84LKK172 pKa = 10.18AGPVATFADD181 pKa = 3.7ADD183 pKa = 3.91YY184 pKa = 10.89NDD186 pKa = 4.91AYY188 pKa = 10.92FSVSPRR194 pKa = 11.84EE195 pKa = 4.05FVNSGGRR202 pKa = 11.84FAAYY206 pKa = 9.77DD207 pKa = 3.26AGGGFNSVGIHH218 pKa = 5.69GEE220 pKa = 3.44ARR222 pKa = 11.84YY223 pKa = 9.76EE224 pKa = 3.82IFTDD228 pKa = 3.64YY229 pKa = 10.62FVNLDD234 pKa = 3.68ASWNRR239 pKa = 11.84LVGDD243 pKa = 4.67AGDD246 pKa = 3.92SPIVKK251 pKa = 9.96VAGDD255 pKa = 3.64DD256 pKa = 3.48DD257 pKa = 3.89QYY259 pKa = 11.69YY260 pKa = 10.34IGLGVSKK267 pKa = 10.56RR268 pKa = 11.84FSLDD272 pKa = 3.03LFF274 pKa = 4.45
Molecular weight: 29.01 kDa
Isoelectric point according different methods:
Protein with the highest isoelectric point:
>tr|A0A371WYS9|A0A371WYS9_9RHIZ TVP38/TMEM64 family membrane protein OS=Fulvimarina endophytica OX=2293836 GN=DYI37_17905 PE=3 SV=1
MM1 pKa = 7.35KK2 pKa = 9.43RR3 pKa = 11.84TYY5 pKa = 10.27QPSKK9 pKa = 9.73LVRR12 pKa = 11.84KK13 pKa = 8.95RR14 pKa = 11.84RR15 pKa = 11.84HH16 pKa = 4.63GFRR19 pKa = 11.84SRR21 pKa = 11.84MATVGGRR28 pKa = 11.84RR29 pKa = 11.84VIASRR34 pKa = 11.84RR35 pKa = 11.84SKK37 pKa = 10.32GRR39 pKa = 11.84KK40 pKa = 8.78RR41 pKa = 11.84LSAA44 pKa = 3.96
MM1 pKa = 7.35KK2 pKa = 9.43RR3 pKa = 11.84TYY5 pKa = 10.27QPSKK9 pKa = 9.73LVRR12 pKa = 11.84KK13 pKa = 8.95RR14 pKa = 11.84RR15 pKa = 11.84HH16 pKa = 4.63GFRR19 pKa = 11.84SRR21 pKa = 11.84MATVGGRR28 pKa = 11.84RR29 pKa = 11.84VIASRR34 pKa = 11.84RR35 pKa = 11.84SKK37 pKa = 10.32GRR39 pKa = 11.84KK40 pKa = 8.78RR41 pKa = 11.84LSAA44 pKa = 3.96
Molecular weight: 5.18 kDa
Isoelectric point according different methods:
Peptides (in silico digests for buttom-up proteomics)
Below you can find in silico digests of the whole proteome with Trypsin, Chymotrypsin, Trypsin+LysC, LysN, ArgC proteases suitable for different mass spec machines.| Try ESI |
 |
|---|
| ChTry ESI |
 |
|---|
| ArgC ESI |
 |
|---|
| LysN ESI |
 |
|---|
| TryLysC ESI |
 |
|---|
| Try MALDI |
 |
|---|
| ChTry MALDI |
 |
|---|
| ArgC MALDI |
 |
|---|
| LysN MALDI |
 |
|---|
| TryLysC MALDI |
 |
|---|
| Try LTQ |
 |
|---|
| ChTry LTQ |
 |
|---|
| ArgC LTQ |
 |
|---|
| LysN LTQ |
 |
|---|
| TryLysC LTQ |
 |
|---|
| Try MSlow |
 |
|---|
| ChTry MSlow |
 |
|---|
| ArgC MSlow |
 |
|---|
| LysN MSlow |
 |
|---|
| TryLysC MSlow |
 |
|---|
| Try MShigh |
 |
|---|
| ChTry MShigh |
 |
|---|
| ArgC MShigh |
 |
|---|
| LysN MShigh |
 |
|---|
| TryLysC MShigh |
 |
|---|
General Statistics
Number of major isoforms |
Number of additional isoforms |
Number of all proteins |
Number of amino acids |
Min. Seq. Length |
Max. Seq. Length |
Avg. Seq. Length |
Avg. Mol. Weight |
|---|---|---|---|---|---|---|---|
0 |
1255505 |
17 |
6238 |
327.6 |
35.45 |
Amino acid frequency
Ala |
Cys |
Asp |
Glu |
Phe |
Gly |
His |
Ile |
Lys |
Leu |
|---|---|---|---|---|---|---|---|---|---|
12.371 ± 0.056 | 0.78 ± 0.012 |
6.016 ± 0.038 | 6.393 ± 0.045 |
3.809 ± 0.03 | 8.902 ± 0.049 |
1.865 ± 0.019 | 5.233 ± 0.029 |
2.995 ± 0.032 | 9.829 ± 0.05 |
Met |
Asn |
Gln |
Pro |
Arg |
Ser |
Thr |
Val |
Trp |
Tyr |
|---|---|---|---|---|---|---|---|---|---|
2.419 ± 0.02 | 2.465 ± 0.024 |
4.972 ± 0.035 | 2.772 ± 0.024 |
7.413 ± 0.049 | 5.869 ± 0.036 |
5.358 ± 0.034 | 7.266 ± 0.033 |
1.166 ± 0.014 | 2.106 ± 0.022 |
Most of the basic statistics you can see at this page can be downloaded from this CSV file
Proteome-pI is available under Creative Commons Attribution-NoDerivs license, for more details see here
| Reference: Kozlowski LP. Proteome-pI 2.0: Proteome Isoelectric Point Database Update. Nucleic Acids Res. 2021, doi: 10.1093/nar/gkab944 | Contact: Lukasz P. Kozlowski |
