Gavia stellata (Red-throated diver) (Colymbus stellatus)
Taxonomy: cellular organisms; Eukaryota; Opisthokonta; Metazoa; Eumetazoa; Bilateria; Deuterostomia; Chordata; Craniata; Vertebrata; Gnathostomata; Teleostomi; Euteleostomi; Sarcopterygii; Dipnotetrapodomorpha; Tetrapoda; Amniota; Sauropsida; Sauria; Archelosauria; Archosauria; Dinosauria; Saurischia; Theropoda;
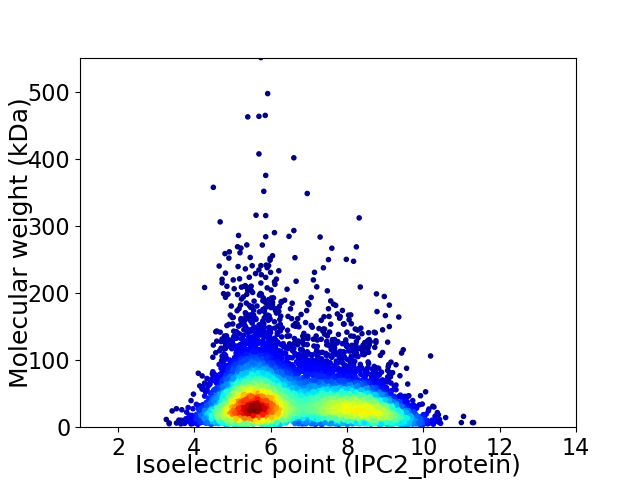
Average proteome isoelectric point is 6.63
Get precalculated fractions of proteins

Virtual 2D-PAGE plot for 7730 proteins (isoelectric point calculated using IPC2_protein)
Get csv file with sequences according to given criteria:
* You can choose from 21 different methods for calculating isoelectric point
Summary statistics related to proteome-wise predictions


Protein with the lowest isoelectric point:
>tr|A0A093FCD2|A0A093FCD2_GAVST Striated muscle-specific serine/threonine-protein kinase (Fragment) OS=Gavia stellata OX=37040 GN=N328_05227 PE=4 SV=1
MM1 pKa = 6.61TTGDD5 pKa = 3.72VLDD8 pKa = 4.14SRR10 pKa = 11.84TAAEE14 pKa = 4.4LRR16 pKa = 11.84LDD18 pKa = 4.02SLYY21 pKa = 10.39LQCMDD26 pKa = 3.28NCKK29 pKa = 10.62ADD31 pKa = 3.62VSDD34 pKa = 4.11VLPKK38 pKa = 10.28QEE40 pKa = 4.23IQSSEE45 pKa = 4.06CQAAASDD52 pKa = 4.2AEE54 pKa = 4.42VLHH57 pKa = 6.03TARR60 pKa = 11.84GHH62 pKa = 4.77YY63 pKa = 6.39TTPEE67 pKa = 3.88VLLSANAPQIDD78 pKa = 3.67ATEE81 pKa = 4.58CEE83 pKa = 4.35VGLADD88 pKa = 4.52TYY90 pKa = 11.44LSPTADD96 pKa = 3.12SCEE99 pKa = 4.25NISLATTDD107 pKa = 4.35KK108 pKa = 11.42GNLPHH113 pKa = 7.14SIVYY117 pKa = 10.03QNEE120 pKa = 3.61EE121 pKa = 4.41GKK123 pKa = 9.57WVTDD127 pKa = 3.51LAYY130 pKa = 9.07YY131 pKa = 10.17TSFDD135 pKa = 3.7EE136 pKa = 4.54EE137 pKa = 3.83QDD139 pKa = 3.52INLSEE144 pKa = 4.41DD145 pKa = 3.39DD146 pKa = 4.69KK147 pKa = 11.6INEE150 pKa = 4.01EE151 pKa = 4.77FITT154 pKa = 4.04
MM1 pKa = 6.61TTGDD5 pKa = 3.72VLDD8 pKa = 4.14SRR10 pKa = 11.84TAAEE14 pKa = 4.4LRR16 pKa = 11.84LDD18 pKa = 4.02SLYY21 pKa = 10.39LQCMDD26 pKa = 3.28NCKK29 pKa = 10.62ADD31 pKa = 3.62VSDD34 pKa = 4.11VLPKK38 pKa = 10.28QEE40 pKa = 4.23IQSSEE45 pKa = 4.06CQAAASDD52 pKa = 4.2AEE54 pKa = 4.42VLHH57 pKa = 6.03TARR60 pKa = 11.84GHH62 pKa = 4.77YY63 pKa = 6.39TTPEE67 pKa = 3.88VLLSANAPQIDD78 pKa = 3.67ATEE81 pKa = 4.58CEE83 pKa = 4.35VGLADD88 pKa = 4.52TYY90 pKa = 11.44LSPTADD96 pKa = 3.12SCEE99 pKa = 4.25NISLATTDD107 pKa = 4.35KK108 pKa = 11.42GNLPHH113 pKa = 7.14SIVYY117 pKa = 10.03QNEE120 pKa = 3.61EE121 pKa = 4.41GKK123 pKa = 9.57WVTDD127 pKa = 3.51LAYY130 pKa = 9.07YY131 pKa = 10.17TSFDD135 pKa = 3.7EE136 pKa = 4.54EE137 pKa = 3.83QDD139 pKa = 3.52INLSEE144 pKa = 4.41DD145 pKa = 3.39DD146 pKa = 4.69KK147 pKa = 11.6INEE150 pKa = 4.01EE151 pKa = 4.77FITT154 pKa = 4.04
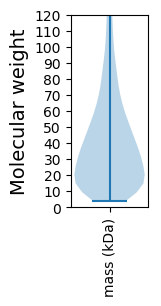
Molecular weight: 16.92 kDa
Isoelectric point according different methods:
Protein with the highest isoelectric point:
>tr|A0A093HCC6|A0A093HCC6_GAVST Membrane progestin receptor beta OS=Gavia stellata OX=37040 GN=N328_12892 PE=3 SV=1
KKK2 pKa = 10.12RR3 pKa = 11.84QGKKK7 pKa = 8.85RR8 pKa = 11.84QGKKK12 pKa = 8.73RR13 pKa = 11.84QGKKK17 pKa = 8.73RR18 pKa = 11.84QGKKK22 pKa = 8.73RR23 pKa = 11.84QGKKK27 pKa = 8.73RR28 pKa = 11.84QGKKK32 pKa = 8.73RR33 pKa = 11.84QGKKK37 pKa = 8.73RR38 pKa = 11.84QGKKK42 pKa = 8.73RR43 pKa = 11.84QGKKK47 pKa = 8.73RR48 pKa = 11.84QGKKK52 pKa = 8.73RR53 pKa = 11.84QGKKK57 pKa = 9.02RR58 pKa = 11.84QSKKK62 pKa = 10.33K
KKK2 pKa = 10.12RR3 pKa = 11.84QGKKK7 pKa = 8.85RR8 pKa = 11.84QGKKK12 pKa = 8.73RR13 pKa = 11.84QGKKK17 pKa = 8.73RR18 pKa = 11.84QGKKK22 pKa = 8.73RR23 pKa = 11.84QGKKK27 pKa = 8.73RR28 pKa = 11.84QGKKK32 pKa = 8.73RR33 pKa = 11.84QGKKK37 pKa = 8.73RR38 pKa = 11.84QGKKK42 pKa = 8.73RR43 pKa = 11.84QGKKK47 pKa = 8.73RR48 pKa = 11.84QGKKK52 pKa = 8.73RR53 pKa = 11.84QGKKK57 pKa = 9.02RR58 pKa = 11.84QSKKK62 pKa = 10.33K
Molecular weight: 6.86 kDa
Isoelectric point according different methods:
Peptides (in silico digests for buttom-up proteomics)
Below you can find in silico digests of the whole proteome with Trypsin, Chymotrypsin, Trypsin+LysC, LysN, ArgC proteases suitable for different mass spec machines.| Try ESI |
 |
|---|
| ChTry ESI |
 |
|---|
| ArgC ESI |
 |
|---|
| LysN ESI |
 |
|---|
| TryLysC ESI |
 |
|---|
| Try MALDI |
 |
|---|
| ChTry MALDI |
 |
|---|
| ArgC MALDI |
 |
|---|
| LysN MALDI |
 |
|---|
| TryLysC MALDI |
 |
|---|
| Try LTQ |
 |
|---|
| ChTry LTQ |
 |
|---|
| ArgC LTQ |
 |
|---|
| LysN LTQ |
 |
|---|
| TryLysC LTQ |
 |
|---|
| Try MSlow |
 |
|---|
| ChTry MSlow |
 |
|---|
| ArgC MSlow |
 |
|---|
| LysN MSlow |
 |
|---|
| TryLysC MSlow |
 |
|---|
| Try MShigh |
 |
|---|
| ChTry MShigh |
 |
|---|
| ArgC MShigh |
 |
|---|
| LysN MShigh |
 |
|---|
| TryLysC MShigh |
 |
|---|
General Statistics
Number of major isoforms |
Number of additional isoforms |
Number of all proteins |
Number of amino acids |
Min. Seq. Length |
Max. Seq. Length |
Avg. Seq. Length |
Avg. Mol. Weight |
|---|---|---|---|---|---|---|---|
0 |
3192604 |
33 |
4973 |
413.0 |
46.46 |
Amino acid frequency
Ala |
Cys |
Asp |
Glu |
Phe |
Gly |
His |
Ile |
Lys |
Leu |
|---|---|---|---|---|---|---|---|---|---|
6.319 ± 0.023 | 2.218 ± 0.024 |
5.037 ± 0.019 | 7.213 ± 0.033 |
3.956 ± 0.02 | 5.74 ± 0.033 |
2.529 ± 0.011 | 5.112 ± 0.019 |
6.563 ± 0.033 | 9.706 ± 0.04 |
Met |
Asn |
Gln |
Pro |
Arg |
Ser |
Thr |
Val |
Trp |
Tyr |
|---|---|---|---|---|---|---|---|---|---|
2.276 ± 0.012 | 4.228 ± 0.019 |
5.195 ± 0.034 | 4.682 ± 0.025 |
5.121 ± 0.019 | 8.167 ± 0.038 |
5.44 ± 0.02 | 6.296 ± 0.023 |
1.175 ± 0.01 | 3.021 ± 0.017 |
Most of the basic statistics you can see at this page can be downloaded from this CSV file
Proteome-pI is available under Creative Commons Attribution-NoDerivs license, for more details see here
| Reference: Kozlowski LP. Proteome-pI 2.0: Proteome Isoelectric Point Database Update. Nucleic Acids Res. 2021, doi: 10.1093/nar/gkab944 | Contact: Lukasz P. Kozlowski |
