Methylomicrobium alcaliphilum (strain DSM 19304 / NCIMB 14124 / VKM B-2133 / 20Z)
Taxonomy: cellular organisms; Bacteria; Proteobacteria; Gammaproteobacteria; Methylococcales; Methylococcaceae; Methylotuvimicrobium; Methylotuvimicrobium alcaliphilum
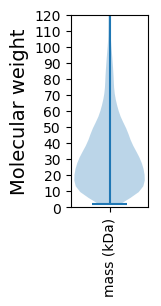
Average proteome isoelectric point is 6.29
Get precalculated fractions of proteins

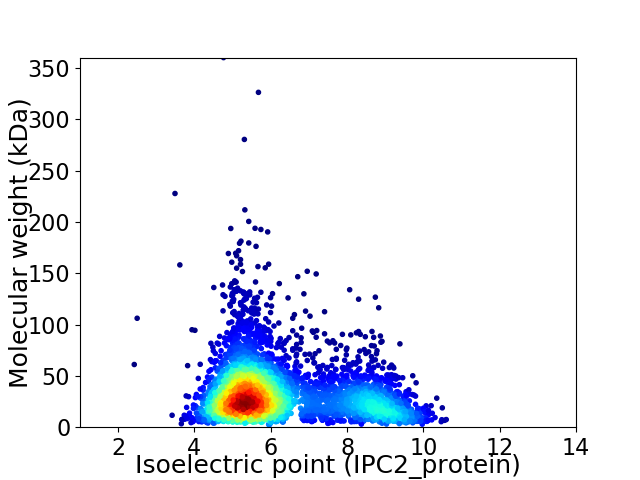
Virtual 2D-PAGE plot for 4041 proteins (isoelectric point calculated using IPC2_protein)
Get csv file with sequences according to given criteria:
* You can choose from 21 different methods for calculating isoelectric point
Summary statistics related to proteome-wise predictions


Protein with the lowest isoelectric point:
>tr|G4SZN5|G4SZN5_META2 Uncharacterized protein OS=Methylomicrobium alcaliphilum (strain DSM 19304 / NCIMB 14124 / VKM B-2133 / 20Z) OX=1091494 GN=MEALZ_2810 PE=4 SV=1
MM1 pKa = 7.18STLKK5 pKa = 9.78TLAAASLIAASGSAAAFTDD24 pKa = 4.64FYY26 pKa = 10.78INNGADD32 pKa = 3.18YY33 pKa = 10.78GGIGTEE39 pKa = 4.11VCPEE43 pKa = 3.69CTGIKK48 pKa = 9.09EE49 pKa = 4.23HH50 pKa = 6.68GAISYY55 pKa = 9.55QSQTLVDD62 pKa = 4.26LQNANQLTVGDD73 pKa = 4.8TITTYY78 pKa = 11.3AGILAGGGNINPQTSGLNQFTAFIPGQPEE107 pKa = 3.73NSNNGLGTNWFMSFYY122 pKa = 8.87TDD124 pKa = 3.33NMKK127 pKa = 9.38GTISDD132 pKa = 4.15LTNPAQPEE140 pKa = 4.03VTYY143 pKa = 10.82TEE145 pKa = 4.12GTINLLYY152 pKa = 10.13STDD155 pKa = 4.23GIDD158 pKa = 3.1WTNFMDD164 pKa = 6.07LIVKK168 pKa = 10.39KK169 pKa = 10.51SVYY172 pKa = 9.32DD173 pKa = 3.55TANNLSITGTVDD185 pKa = 4.05FSDD188 pKa = 4.41VDD190 pKa = 3.8DD191 pKa = 5.21LVYY194 pKa = 10.94KK195 pKa = 10.75DD196 pKa = 4.9LFNFADD202 pKa = 3.9GTSFYY207 pKa = 10.5DD208 pKa = 2.76IWLAGEE214 pKa = 4.74DD215 pKa = 3.85FDD217 pKa = 6.65IPFQLDD223 pKa = 3.18QNLGVPTIDD232 pKa = 4.34FLDD235 pKa = 4.01AGTAKK240 pKa = 10.45IAGTHH245 pKa = 5.87GAQLYY250 pKa = 10.03FDD252 pKa = 4.68TVPEE256 pKa = 4.3PATLALLGFGLLGFAGARR274 pKa = 11.84KK275 pKa = 9.29RR276 pKa = 11.84RR277 pKa = 11.84LAA279 pKa = 3.84
MM1 pKa = 7.18STLKK5 pKa = 9.78TLAAASLIAASGSAAAFTDD24 pKa = 4.64FYY26 pKa = 10.78INNGADD32 pKa = 3.18YY33 pKa = 10.78GGIGTEE39 pKa = 4.11VCPEE43 pKa = 3.69CTGIKK48 pKa = 9.09EE49 pKa = 4.23HH50 pKa = 6.68GAISYY55 pKa = 9.55QSQTLVDD62 pKa = 4.26LQNANQLTVGDD73 pKa = 4.8TITTYY78 pKa = 11.3AGILAGGGNINPQTSGLNQFTAFIPGQPEE107 pKa = 3.73NSNNGLGTNWFMSFYY122 pKa = 8.87TDD124 pKa = 3.33NMKK127 pKa = 9.38GTISDD132 pKa = 4.15LTNPAQPEE140 pKa = 4.03VTYY143 pKa = 10.82TEE145 pKa = 4.12GTINLLYY152 pKa = 10.13STDD155 pKa = 4.23GIDD158 pKa = 3.1WTNFMDD164 pKa = 6.07LIVKK168 pKa = 10.39KK169 pKa = 10.51SVYY172 pKa = 9.32DD173 pKa = 3.55TANNLSITGTVDD185 pKa = 4.05FSDD188 pKa = 4.41VDD190 pKa = 3.8DD191 pKa = 5.21LVYY194 pKa = 10.94KK195 pKa = 10.75DD196 pKa = 4.9LFNFADD202 pKa = 3.9GTSFYY207 pKa = 10.5DD208 pKa = 2.76IWLAGEE214 pKa = 4.74DD215 pKa = 3.85FDD217 pKa = 6.65IPFQLDD223 pKa = 3.18QNLGVPTIDD232 pKa = 4.34FLDD235 pKa = 4.01AGTAKK240 pKa = 10.45IAGTHH245 pKa = 5.87GAQLYY250 pKa = 10.03FDD252 pKa = 4.68TVPEE256 pKa = 4.3PATLALLGFGLLGFAGARR274 pKa = 11.84KK275 pKa = 9.29RR276 pKa = 11.84RR277 pKa = 11.84LAA279 pKa = 3.84
Molecular weight: 29.75 kDa
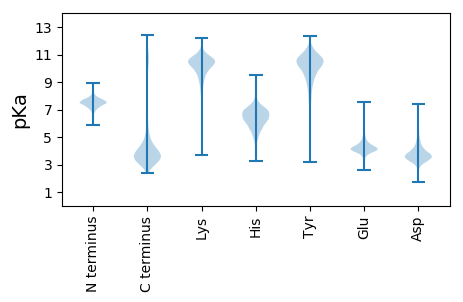
Isoelectric point according different methods:
Protein with the highest isoelectric point:
>tr|G4SY35|G4SY35_META2 Peptide methionine sulfoxide reductase MsrB OS=Methylomicrobium alcaliphilum (strain DSM 19304 / NCIMB 14124 / VKM B-2133 / 20Z) OX=1091494 GN=msrB PE=3 SV=1
MM1 pKa = 7.52GWPFLALCAWAPGRR15 pKa = 11.84IFIYY19 pKa = 9.9EE20 pKa = 4.27GYY22 pKa = 10.01IYY24 pKa = 10.44RR25 pKa = 11.84AVNRR29 pKa = 11.84IPALKK34 pKa = 9.79IIEE37 pKa = 4.17QFFRR41 pKa = 11.84MKK43 pKa = 10.69GAMRR47 pKa = 11.84NPSLILNIRR56 pKa = 11.84PSRR59 pKa = 11.84LLLISKK65 pKa = 8.0CRR67 pKa = 11.84CC68 pKa = 3.17
MM1 pKa = 7.52GWPFLALCAWAPGRR15 pKa = 11.84IFIYY19 pKa = 9.9EE20 pKa = 4.27GYY22 pKa = 10.01IYY24 pKa = 10.44RR25 pKa = 11.84AVNRR29 pKa = 11.84IPALKK34 pKa = 9.79IIEE37 pKa = 4.17QFFRR41 pKa = 11.84MKK43 pKa = 10.69GAMRR47 pKa = 11.84NPSLILNIRR56 pKa = 11.84PSRR59 pKa = 11.84LLLISKK65 pKa = 8.0CRR67 pKa = 11.84CC68 pKa = 3.17
Molecular weight: 7.96 kDa
Isoelectric point according different methods:
Peptides (in silico digests for buttom-up proteomics)
Below you can find in silico digests of the whole proteome with Trypsin, Chymotrypsin, Trypsin+LysC, LysN, ArgC proteases suitable for different mass spec machines.| Try ESI |
 |
|---|
| ChTry ESI |
 |
|---|
| ArgC ESI |
 |
|---|
| LysN ESI |
 |
|---|
| TryLysC ESI |
 |
|---|
| Try MALDI |
 |
|---|
| ChTry MALDI |
 |
|---|
| ArgC MALDI |
 |
|---|
| LysN MALDI |
 |
|---|
| TryLysC MALDI |
 |
|---|
| Try LTQ |
 |
|---|
| ChTry LTQ |
 |
|---|
| ArgC LTQ |
 |
|---|
| LysN LTQ |
 |
|---|
| TryLysC LTQ |
 |
|---|
| Try MSlow |
 |
|---|
| ChTry MSlow |
 |
|---|
| ArgC MSlow |
 |
|---|
| LysN MSlow |
 |
|---|
| TryLysC MSlow |
 |
|---|
| Try MShigh |
 |
|---|
| ChTry MShigh |
 |
|---|
| ArgC MShigh |
 |
|---|
| LysN MShigh |
 |
|---|
| TryLysC MShigh |
 |
|---|
General Statistics
Number of major isoforms |
Number of additional isoforms |
Number of all proteins |
Number of amino acids |
Min. Seq. Length |
Max. Seq. Length |
Avg. Seq. Length |
Avg. Mol. Weight |
|---|---|---|---|---|---|---|---|
0 |
1287047 |
20 |
3437 |
318.5 |
35.51 |
Amino acid frequency
Ala |
Cys |
Asp |
Glu |
Phe |
Gly |
His |
Ile |
Lys |
Leu |
|---|---|---|---|---|---|---|---|---|---|
8.834 ± 0.037 | 1.013 ± 0.014 |
5.753 ± 0.04 | 6.464 ± 0.031 |
4.143 ± 0.029 | 6.885 ± 0.037 |
2.288 ± 0.019 | 6.643 ± 0.035 |
5.036 ± 0.038 | 10.767 ± 0.044 |
Met |
Asn |
Gln |
Pro |
Arg |
Ser |
Thr |
Val |
Trp |
Tyr |
|---|---|---|---|---|---|---|---|---|---|
2.399 ± 0.018 | 3.888 ± 0.028 |
4.306 ± 0.025 | 4.245 ± 0.03 |
5.61 ± 0.03 | 6.05 ± 0.03 |
5.058 ± 0.03 | 6.445 ± 0.029 |
1.259 ± 0.015 | 2.916 ± 0.022 |
Most of the basic statistics you can see at this page can be downloaded from this CSV file
Proteome-pI is available under Creative Commons Attribution-NoDerivs license, for more details see here
| Reference: Kozlowski LP. Proteome-pI 2.0: Proteome Isoelectric Point Database Update. Nucleic Acids Res. 2021, doi: 10.1093/nar/gkab944 | Contact: Lukasz P. Kozlowski |
