Streptococcus pantholopis
Taxonomy: cellular organisms; Bacteria; Terrabacteria group; Firmicutes; Bacilli; Lactobacillales; Streptococcaceae; Streptococcus
Average proteome isoelectric point is 6.25
Get precalculated fractions of proteins

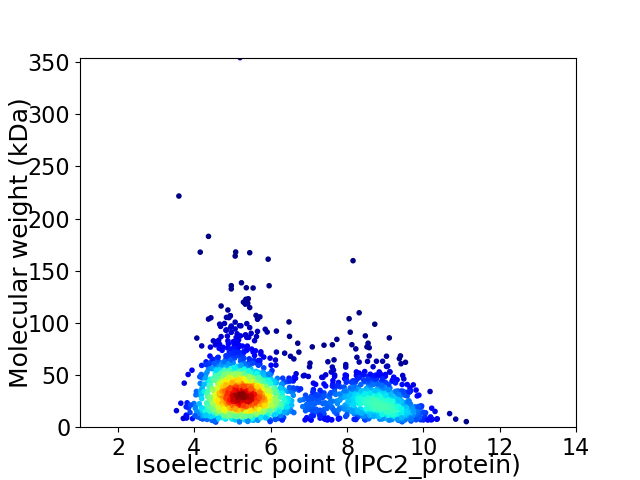
Virtual 2D-PAGE plot for 1974 proteins (isoelectric point calculated using IPC2_protein)
Get csv file with sequences according to given criteria:
* You can choose from 21 different methods for calculating isoelectric point
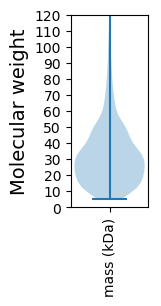
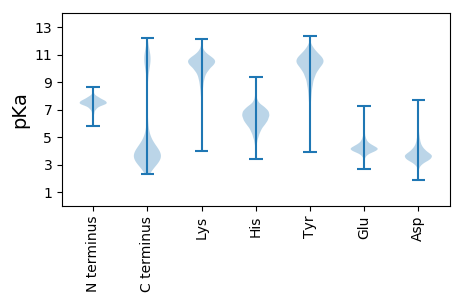
Summary statistics related to proteome-wise predictions


Protein with the lowest isoelectric point:
>tr|A0A172Q7Y7|A0A172Q7Y7_9STRE Uncharacterized protein OS=Streptococcus pantholopis OX=1811193 GN=A0O21_05815 PE=4 SV=1
MM1 pKa = 7.44ARR3 pKa = 11.84HH4 pKa = 6.16RR5 pKa = 11.84KK6 pKa = 9.13KK7 pKa = 10.82ADD9 pKa = 3.1NSNTLRR15 pKa = 11.84IFLILGVVLLALGLIIFAVSSYY37 pKa = 10.76INNRR41 pKa = 11.84EE42 pKa = 3.94SSTTTSSSTAQTLMSSSDD60 pKa = 3.16TSEE63 pKa = 3.9NTEE66 pKa = 4.01TSQTDD71 pKa = 3.31QALDD75 pKa = 3.18IAALANEE82 pKa = 5.31DD83 pKa = 3.94YY84 pKa = 11.29NSAAGVWLSSNGNSLTFNAEE104 pKa = 3.92GLEE107 pKa = 4.11SSDD110 pKa = 3.06IQGTIDD116 pKa = 3.72FTITPYY122 pKa = 10.51QQLDD126 pKa = 3.86DD127 pKa = 3.95NTYY130 pKa = 10.87LATLTSADD138 pKa = 3.23GSLVYY143 pKa = 10.48DD144 pKa = 4.44LYY146 pKa = 11.06FIKK149 pKa = 10.54AGSEE153 pKa = 3.91LPEE156 pKa = 5.09DD157 pKa = 4.25YY158 pKa = 10.36FAEE161 pKa = 5.75GYY163 pKa = 9.12TDD165 pKa = 3.76TSDD168 pKa = 3.24HH169 pKa = 7.04DD170 pKa = 4.06KK171 pKa = 11.3DD172 pKa = 3.5RR173 pKa = 11.84LYY175 pKa = 9.82ITSDD179 pKa = 3.21LVGGEE184 pKa = 4.71DD185 pKa = 3.69YY186 pKa = 11.4ADD188 pKa = 4.07NILYY192 pKa = 9.9RR193 pKa = 11.84QQ194 pKa = 3.42
MM1 pKa = 7.44ARR3 pKa = 11.84HH4 pKa = 6.16RR5 pKa = 11.84KK6 pKa = 9.13KK7 pKa = 10.82ADD9 pKa = 3.1NSNTLRR15 pKa = 11.84IFLILGVVLLALGLIIFAVSSYY37 pKa = 10.76INNRR41 pKa = 11.84EE42 pKa = 3.94SSTTTSSSTAQTLMSSSDD60 pKa = 3.16TSEE63 pKa = 3.9NTEE66 pKa = 4.01TSQTDD71 pKa = 3.31QALDD75 pKa = 3.18IAALANEE82 pKa = 5.31DD83 pKa = 3.94YY84 pKa = 11.29NSAAGVWLSSNGNSLTFNAEE104 pKa = 3.92GLEE107 pKa = 4.11SSDD110 pKa = 3.06IQGTIDD116 pKa = 3.72FTITPYY122 pKa = 10.51QQLDD126 pKa = 3.86DD127 pKa = 3.95NTYY130 pKa = 10.87LATLTSADD138 pKa = 3.23GSLVYY143 pKa = 10.48DD144 pKa = 4.44LYY146 pKa = 11.06FIKK149 pKa = 10.54AGSEE153 pKa = 3.91LPEE156 pKa = 5.09DD157 pKa = 4.25YY158 pKa = 10.36FAEE161 pKa = 5.75GYY163 pKa = 9.12TDD165 pKa = 3.76TSDD168 pKa = 3.24HH169 pKa = 7.04DD170 pKa = 4.06KK171 pKa = 11.3DD172 pKa = 3.5RR173 pKa = 11.84LYY175 pKa = 9.82ITSDD179 pKa = 3.21LVGGEE184 pKa = 4.71DD185 pKa = 3.69YY186 pKa = 11.4ADD188 pKa = 4.07NILYY192 pKa = 9.9RR193 pKa = 11.84QQ194 pKa = 3.42
Molecular weight: 21.2 kDa
Isoelectric point according different methods:
Protein with the highest isoelectric point:
>tr|A0A172Q571|A0A172Q571_9STRE Argininosuccinate lyase OS=Streptococcus pantholopis OX=1811193 GN=argH PE=3 SV=1
MM1 pKa = 7.35KK2 pKa = 9.43RR3 pKa = 11.84TYY5 pKa = 10.07QPSKK9 pKa = 9.67IRR11 pKa = 11.84RR12 pKa = 11.84QRR14 pKa = 11.84KK15 pKa = 7.52HH16 pKa = 5.18GFRR19 pKa = 11.84HH20 pKa = 6.46RR21 pKa = 11.84MATKK25 pKa = 10.2NGRR28 pKa = 11.84HH29 pKa = 4.81VLASRR34 pKa = 11.84RR35 pKa = 11.84RR36 pKa = 11.84KK37 pKa = 8.73GRR39 pKa = 11.84KK40 pKa = 8.76VLSAA44 pKa = 4.05
MM1 pKa = 7.35KK2 pKa = 9.43RR3 pKa = 11.84TYY5 pKa = 10.07QPSKK9 pKa = 9.67IRR11 pKa = 11.84RR12 pKa = 11.84QRR14 pKa = 11.84KK15 pKa = 7.52HH16 pKa = 5.18GFRR19 pKa = 11.84HH20 pKa = 6.46RR21 pKa = 11.84MATKK25 pKa = 10.2NGRR28 pKa = 11.84HH29 pKa = 4.81VLASRR34 pKa = 11.84RR35 pKa = 11.84RR36 pKa = 11.84KK37 pKa = 8.73GRR39 pKa = 11.84KK40 pKa = 8.76VLSAA44 pKa = 4.05
Molecular weight: 5.34 kDa
Isoelectric point according different methods:
Peptides (in silico digests for buttom-up proteomics)
Below you can find in silico digests of the whole proteome with Trypsin, Chymotrypsin, Trypsin+LysC, LysN, ArgC proteases suitable for different mass spec machines.| Try ESI |
 |
|---|
| ChTry ESI |
 |
|---|
| ArgC ESI |
 |
|---|
| LysN ESI |
 |
|---|
| TryLysC ESI |
 |
|---|
| Try MALDI |
 |
|---|
| ChTry MALDI |
 |
|---|
| ArgC MALDI |
 |
|---|
| LysN MALDI |
 |
|---|
| TryLysC MALDI |
 |
|---|
| Try LTQ |
 |
|---|
| ChTry LTQ |
 |
|---|
| ArgC LTQ |
 |
|---|
| LysN LTQ |
 |
|---|
| TryLysC LTQ |
 |
|---|
| Try MSlow |
 |
|---|
| ChTry MSlow |
 |
|---|
| ArgC MSlow |
 |
|---|
| LysN MSlow |
 |
|---|
| TryLysC MSlow |
 |
|---|
| Try MShigh |
 |
|---|
| ChTry MShigh |
 |
|---|
| ArgC MShigh |
 |
|---|
| LysN MShigh |
 |
|---|
| TryLysC MShigh |
 |
|---|
General Statistics
Number of major isoforms |
Number of additional isoforms |
Number of all proteins |
Number of amino acids |
Min. Seq. Length |
Max. Seq. Length |
Avg. Seq. Length |
Avg. Mol. Weight |
|---|---|---|---|---|---|---|---|
0 |
602372 |
43 |
3130 |
305.2 |
34.08 |
Amino acid frequency
Ala |
Cys |
Asp |
Glu |
Phe |
Gly |
His |
Ile |
Lys |
Leu |
|---|---|---|---|---|---|---|---|---|---|
8.458 ± 0.066 | 0.559 ± 0.015 |
5.764 ± 0.045 | 6.592 ± 0.056 |
4.58 ± 0.041 | 6.552 ± 0.054 |
1.852 ± 0.028 | 7.112 ± 0.052 |
6.363 ± 0.051 | 10.375 ± 0.075 |
Met |
Asn |
Gln |
Pro |
Arg |
Ser |
Thr |
Val |
Trp |
Tyr |
|---|---|---|---|---|---|---|---|---|---|
2.342 ± 0.024 | 4.241 ± 0.04 |
3.32 ± 0.036 | 4.225 ± 0.038 |
4.185 ± 0.038 | 6.489 ± 0.052 |
5.616 ± 0.06 | 6.618 ± 0.045 |
0.889 ± 0.021 | 3.865 ± 0.04 |
Most of the basic statistics you can see at this page can be downloaded from this CSV file
Proteome-pI is available under Creative Commons Attribution-NoDerivs license, for more details see here
| Reference: Kozlowski LP. Proteome-pI 2.0: Proteome Isoelectric Point Database Update. Nucleic Acids Res. 2021, doi: 10.1093/nar/gkab944 | Contact: Lukasz P. Kozlowski |
