Acinetobacter marinus
Taxonomy: cellular organisms; Bacteria; Proteobacteria; Gammaproteobacteria; Pseudomonadales; Moraxellaceae; Acinetobacter
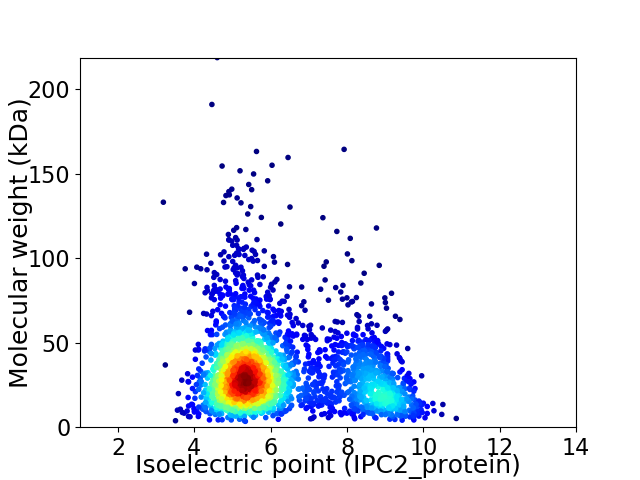
Average proteome isoelectric point is 6.25
Get precalculated fractions of proteins

Virtual 2D-PAGE plot for 2744 proteins (isoelectric point calculated using IPC2_protein)
Get csv file with sequences according to given criteria:
* You can choose from 21 different methods for calculating isoelectric point
Summary statistics related to proteome-wise predictions


Protein with the lowest isoelectric point:
>tr|A0A1G6MZ23|A0A1G6MZ23_9GAMM 3-deoxy-D-manno-octulosonic acid transferase OS=Acinetobacter marinus OX=281375 GN=SAMN05421749_10862 PE=3 SV=1
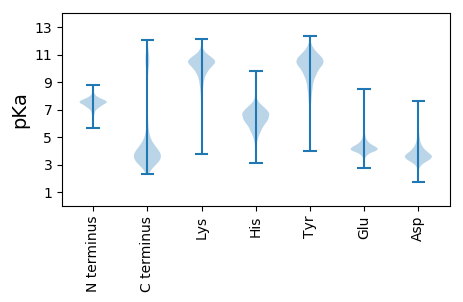
MM1 pKa = 7.49NKK3 pKa = 8.39LTLATAILAASSSFAMVNANAYY25 pKa = 8.44QFEE28 pKa = 4.48VGAGAGYY35 pKa = 10.66VDD37 pKa = 5.17PDD39 pKa = 3.76NGDD42 pKa = 3.38SGSAFDD48 pKa = 5.98LGGTYY53 pKa = 10.36YY54 pKa = 10.8FNPVEE59 pKa = 4.83DD60 pKa = 4.13KK61 pKa = 10.88NAPLAEE67 pKa = 3.93AAFVNRR73 pKa = 11.84ASNVHH78 pKa = 6.42AGATFQDD85 pKa = 3.82QGDD88 pKa = 4.76LDD90 pKa = 4.4TNTYY94 pKa = 9.2GAGVEE99 pKa = 4.18YY100 pKa = 9.69FVPNSNFYY108 pKa = 11.16VSGDD112 pKa = 3.31IAKK115 pKa = 9.37TNYY118 pKa = 9.93EE119 pKa = 4.2YY120 pKa = 11.32DD121 pKa = 4.39DD122 pKa = 4.92ADD124 pKa = 3.62IDD126 pKa = 4.25NDD128 pKa = 3.56LTTYY132 pKa = 9.98SAEE135 pKa = 4.02VGYY138 pKa = 10.76LPVPNLLIAVGARR151 pKa = 11.84GWDD154 pKa = 3.41ADD156 pKa = 4.56DD157 pKa = 5.94DD158 pKa = 5.12DD159 pKa = 6.13GVDD162 pKa = 3.22PTLRR166 pKa = 11.84AKK168 pKa = 10.53YY169 pKa = 8.57VTQIGDD175 pKa = 3.32NAVNLEE181 pKa = 3.98AGAAFGDD188 pKa = 3.54LDD190 pKa = 4.55EE191 pKa = 5.29YY192 pKa = 11.76NLAADD197 pKa = 3.83YY198 pKa = 10.78FIDD201 pKa = 3.5NSFSVGADD209 pKa = 3.32YY210 pKa = 11.33YY211 pKa = 11.85SNDD214 pKa = 3.33LTDD217 pKa = 3.57NSEE220 pKa = 4.04FGINARR226 pKa = 11.84KK227 pKa = 9.54FITQNTSLEE236 pKa = 4.06GRR238 pKa = 11.84VGFGDD243 pKa = 4.34TNDD246 pKa = 3.31NDD248 pKa = 3.93YY249 pKa = 11.66NSFGIAAKK257 pKa = 10.38HH258 pKa = 5.54RR259 pKa = 11.84FF260 pKa = 3.48
MM1 pKa = 7.49NKK3 pKa = 8.39LTLATAILAASSSFAMVNANAYY25 pKa = 8.44QFEE28 pKa = 4.48VGAGAGYY35 pKa = 10.66VDD37 pKa = 5.17PDD39 pKa = 3.76NGDD42 pKa = 3.38SGSAFDD48 pKa = 5.98LGGTYY53 pKa = 10.36YY54 pKa = 10.8FNPVEE59 pKa = 4.83DD60 pKa = 4.13KK61 pKa = 10.88NAPLAEE67 pKa = 3.93AAFVNRR73 pKa = 11.84ASNVHH78 pKa = 6.42AGATFQDD85 pKa = 3.82QGDD88 pKa = 4.76LDD90 pKa = 4.4TNTYY94 pKa = 9.2GAGVEE99 pKa = 4.18YY100 pKa = 9.69FVPNSNFYY108 pKa = 11.16VSGDD112 pKa = 3.31IAKK115 pKa = 9.37TNYY118 pKa = 9.93EE119 pKa = 4.2YY120 pKa = 11.32DD121 pKa = 4.39DD122 pKa = 4.92ADD124 pKa = 3.62IDD126 pKa = 4.25NDD128 pKa = 3.56LTTYY132 pKa = 9.98SAEE135 pKa = 4.02VGYY138 pKa = 10.76LPVPNLLIAVGARR151 pKa = 11.84GWDD154 pKa = 3.41ADD156 pKa = 4.56DD157 pKa = 5.94DD158 pKa = 5.12DD159 pKa = 6.13GVDD162 pKa = 3.22PTLRR166 pKa = 11.84AKK168 pKa = 10.53YY169 pKa = 8.57VTQIGDD175 pKa = 3.32NAVNLEE181 pKa = 3.98AGAAFGDD188 pKa = 3.54LDD190 pKa = 4.55EE191 pKa = 5.29YY192 pKa = 11.76NLAADD197 pKa = 3.83YY198 pKa = 10.78FIDD201 pKa = 3.5NSFSVGADD209 pKa = 3.32YY210 pKa = 11.33YY211 pKa = 11.85SNDD214 pKa = 3.33LTDD217 pKa = 3.57NSEE220 pKa = 4.04FGINARR226 pKa = 11.84KK227 pKa = 9.54FITQNTSLEE236 pKa = 4.06GRR238 pKa = 11.84VGFGDD243 pKa = 4.34TNDD246 pKa = 3.31NDD248 pKa = 3.93YY249 pKa = 11.66NSFGIAAKK257 pKa = 10.38HH258 pKa = 5.54RR259 pKa = 11.84FF260 pKa = 3.48
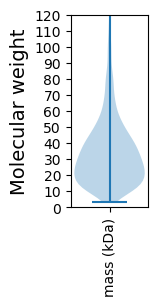
Molecular weight: 27.86 kDa
Isoelectric point according different methods:
Protein with the highest isoelectric point:
>tr|A0A1G6NXF0|A0A1G6NXF0_9GAMM Uncharacterized protein OS=Acinetobacter marinus OX=281375 GN=SAMN05421749_11142 PE=4 SV=1
MM1 pKa = 7.45KK2 pKa = 9.55RR3 pKa = 11.84TFQPSEE9 pKa = 3.97LKK11 pKa = 10.13RR12 pKa = 11.84KK13 pKa = 8.98RR14 pKa = 11.84VHH16 pKa = 6.36GFRR19 pKa = 11.84ARR21 pKa = 11.84MATKK25 pKa = 10.4AGRR28 pKa = 11.84QVLARR33 pKa = 11.84RR34 pKa = 11.84RR35 pKa = 11.84AKK37 pKa = 10.18GRR39 pKa = 11.84HH40 pKa = 5.1SLTVV44 pKa = 3.06
MM1 pKa = 7.45KK2 pKa = 9.55RR3 pKa = 11.84TFQPSEE9 pKa = 3.97LKK11 pKa = 10.13RR12 pKa = 11.84KK13 pKa = 8.98RR14 pKa = 11.84VHH16 pKa = 6.36GFRR19 pKa = 11.84ARR21 pKa = 11.84MATKK25 pKa = 10.4AGRR28 pKa = 11.84QVLARR33 pKa = 11.84RR34 pKa = 11.84RR35 pKa = 11.84AKK37 pKa = 10.18GRR39 pKa = 11.84HH40 pKa = 5.1SLTVV44 pKa = 3.06
Molecular weight: 5.18 kDa
Isoelectric point according different methods:
Peptides (in silico digests for buttom-up proteomics)
Below you can find in silico digests of the whole proteome with Trypsin, Chymotrypsin, Trypsin+LysC, LysN, ArgC proteases suitable for different mass spec machines.| Try ESI |
 |
|---|
| ChTry ESI |
 |
|---|
| ArgC ESI |
 |
|---|
| LysN ESI |
 |
|---|
| TryLysC ESI |
 |
|---|
| Try MALDI |
 |
|---|
| ChTry MALDI |
 |
|---|
| ArgC MALDI |
 |
|---|
| LysN MALDI |
 |
|---|
| TryLysC MALDI |
 |
|---|
| Try LTQ |
 |
|---|
| ChTry LTQ |
 |
|---|
| ArgC LTQ |
 |
|---|
| LysN LTQ |
 |
|---|
| TryLysC LTQ |
 |
|---|
| Try MSlow |
 |
|---|
| ChTry MSlow |
 |
|---|
| ArgC MSlow |
 |
|---|
| LysN MSlow |
 |
|---|
| TryLysC MSlow |
 |
|---|
| Try MShigh |
 |
|---|
| ChTry MShigh |
 |
|---|
| ArgC MShigh |
 |
|---|
| LysN MShigh |
 |
|---|
| TryLysC MShigh |
 |
|---|
General Statistics
Number of major isoforms |
Number of additional isoforms |
Number of all proteins |
Number of amino acids |
Min. Seq. Length |
Max. Seq. Length |
Avg. Seq. Length |
Avg. Mol. Weight |
|---|---|---|---|---|---|---|---|
0 |
866506 |
31 |
1998 |
315.8 |
35.23 |
Amino acid frequency
Ala |
Cys |
Asp |
Glu |
Phe |
Gly |
His |
Ile |
Lys |
Leu |
|---|---|---|---|---|---|---|---|---|---|
9.059 ± 0.054 | 0.957 ± 0.016 |
5.658 ± 0.04 | 5.649 ± 0.051 |
4.141 ± 0.037 | 6.39 ± 0.05 |
2.521 ± 0.029 | 6.532 ± 0.035 |
5.123 ± 0.04 | 10.147 ± 0.06 |
Met |
Asn |
Gln |
Pro |
Arg |
Ser |
Thr |
Val |
Trp |
Tyr |
|---|---|---|---|---|---|---|---|---|---|
2.602 ± 0.026 | 4.27 ± 0.034 |
3.855 ± 0.025 | 5.957 ± 0.055 |
4.486 ± 0.037 | 6.207 ± 0.039 |
5.389 ± 0.044 | 6.597 ± 0.039 |
1.254 ± 0.018 | 3.205 ± 0.032 |
Most of the basic statistics you can see at this page can be downloaded from this CSV file
Proteome-pI is available under Creative Commons Attribution-NoDerivs license, for more details see here
| Reference: Kozlowski LP. Proteome-pI 2.0: Proteome Isoelectric Point Database Update. Nucleic Acids Res. 2021, doi: 10.1093/nar/gkab944 | Contact: Lukasz P. Kozlowski |
