Xanthomonas phage XacN1
Taxonomy: Viruses; Duplodnaviria; Heunggongvirae; Uroviricota; Caudoviricetes; Caudovirales; Myoviridae; unclassified Myoviridae
Average proteome isoelectric point is 6.31
Get precalculated fractions of proteins

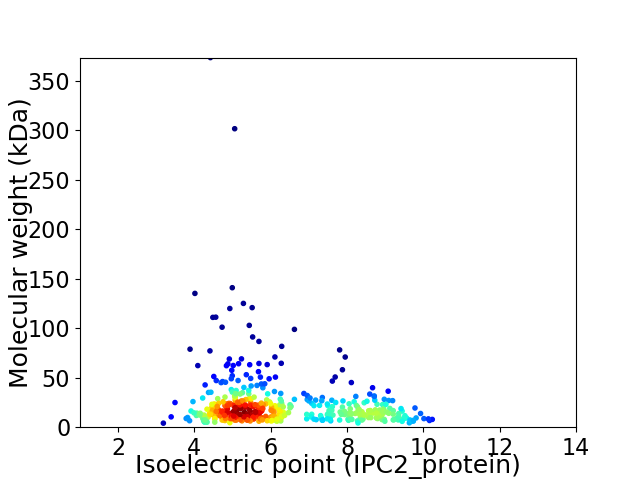
Virtual 2D-PAGE plot for 459 proteins (isoelectric point calculated using IPC2_protein)
Get csv file with sequences according to given criteria:
* You can choose from 21 different methods for calculating isoelectric point
Summary statistics related to proteome-wise predictions


Protein with the lowest isoelectric point:
>tr|A0A292GIX2|A0A292GIX2_9CAUD Predicted ORF OS=Xanthomonas phage XacN1 OX=2042251 PE=4 SV=1
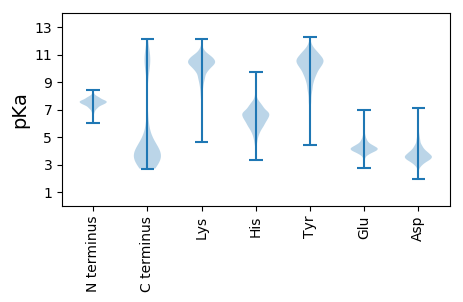
MM1 pKa = 7.1SQRR4 pKa = 11.84ISDD7 pKa = 4.28LTPVSSIAGDD17 pKa = 3.63EE18 pKa = 4.15LVEE21 pKa = 4.16VAVPNSEE28 pKa = 4.19SPTGYY33 pKa = 9.94VSRR36 pKa = 11.84SASTSLFGGGGGLPYY51 pKa = 10.72RR52 pKa = 11.84FTFEE56 pKa = 5.23INDD59 pKa = 3.64EE60 pKa = 4.77PIGSDD65 pKa = 4.79LSFQLYY71 pKa = 10.06LEE73 pKa = 4.76KK74 pKa = 11.09GQFDD78 pKa = 3.82STAFRR83 pKa = 11.84PNADD87 pKa = 3.92SDD89 pKa = 4.3PDD91 pKa = 4.35GDD93 pKa = 3.72WTLATAIMNFNAIAGFHH110 pKa = 6.53FSSEE114 pKa = 4.52DD115 pKa = 3.16NFQFYY120 pKa = 10.94AFSPLNSSVWVNKK133 pKa = 9.72MGGALGSGADD143 pKa = 3.63SDD145 pKa = 4.95ADD147 pKa = 3.44QLRR150 pKa = 11.84WGTFNNSNDD159 pKa = 3.12LSIYY163 pKa = 9.44QIPDD167 pKa = 3.16NYY169 pKa = 10.31PSSNYY174 pKa = 9.27MNNTPVIAPVEE185 pKa = 4.29VYY187 pKa = 10.69EE188 pKa = 5.28DD189 pKa = 4.2GNFGPDD195 pKa = 3.09GSIVIRR201 pKa = 11.84FRR203 pKa = 11.84VVSPYY208 pKa = 10.6NGWGTYY214 pKa = 8.91PQTFSLKK221 pKa = 10.2GYY223 pKa = 10.53ADD225 pKa = 3.21INMAFSNFYY234 pKa = 10.67RR235 pKa = 11.84PAA237 pKa = 5.35
MM1 pKa = 7.1SQRR4 pKa = 11.84ISDD7 pKa = 4.28LTPVSSIAGDD17 pKa = 3.63EE18 pKa = 4.15LVEE21 pKa = 4.16VAVPNSEE28 pKa = 4.19SPTGYY33 pKa = 9.94VSRR36 pKa = 11.84SASTSLFGGGGGLPYY51 pKa = 10.72RR52 pKa = 11.84FTFEE56 pKa = 5.23INDD59 pKa = 3.64EE60 pKa = 4.77PIGSDD65 pKa = 4.79LSFQLYY71 pKa = 10.06LEE73 pKa = 4.76KK74 pKa = 11.09GQFDD78 pKa = 3.82STAFRR83 pKa = 11.84PNADD87 pKa = 3.92SDD89 pKa = 4.3PDD91 pKa = 4.35GDD93 pKa = 3.72WTLATAIMNFNAIAGFHH110 pKa = 6.53FSSEE114 pKa = 4.52DD115 pKa = 3.16NFQFYY120 pKa = 10.94AFSPLNSSVWVNKK133 pKa = 9.72MGGALGSGADD143 pKa = 3.63SDD145 pKa = 4.95ADD147 pKa = 3.44QLRR150 pKa = 11.84WGTFNNSNDD159 pKa = 3.12LSIYY163 pKa = 9.44QIPDD167 pKa = 3.16NYY169 pKa = 10.31PSSNYY174 pKa = 9.27MNNTPVIAPVEE185 pKa = 4.29VYY187 pKa = 10.69EE188 pKa = 5.28DD189 pKa = 4.2GNFGPDD195 pKa = 3.09GSIVIRR201 pKa = 11.84FRR203 pKa = 11.84VVSPYY208 pKa = 10.6NGWGTYY214 pKa = 8.91PQTFSLKK221 pKa = 10.2GYY223 pKa = 10.53ADD225 pKa = 3.21INMAFSNFYY234 pKa = 10.67RR235 pKa = 11.84PAA237 pKa = 5.35
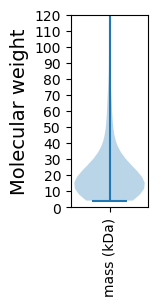
Molecular weight: 25.87 kDa
Isoelectric point according different methods:
Protein with the highest isoelectric point:
>tr|A0A292GI63|A0A292GI63_9CAUD Predicted ORF OS=Xanthomonas phage XacN1 OX=2042251 PE=4 SV=1
MM1 pKa = 7.73SIEE4 pKa = 4.08ATIMGYY10 pKa = 7.79FHH12 pKa = 7.55EE13 pKa = 4.93YY14 pKa = 9.34DD15 pKa = 3.25AKK17 pKa = 11.09ARR19 pKa = 11.84ALYY22 pKa = 8.74PAYY25 pKa = 10.18AARR28 pKa = 11.84PVPKK32 pKa = 10.29VSFFAKK38 pKa = 10.09GRR40 pKa = 11.84MNGWAKK46 pKa = 9.8QGSWEE51 pKa = 4.32VQFNTHH57 pKa = 6.11NASQVPEE64 pKa = 4.1EE65 pKa = 3.93FRR67 pKa = 11.84NTVSHH72 pKa = 7.09EE73 pKa = 3.78IAHH76 pKa = 5.65MVDD79 pKa = 3.0YY80 pKa = 10.9ALRR83 pKa = 11.84GRR85 pKa = 11.84SGHH88 pKa = 5.59DD89 pKa = 3.69RR90 pKa = 11.84IWKK93 pKa = 9.55AIHH96 pKa = 6.61RR97 pKa = 11.84SLGGTGTRR105 pKa = 11.84CSQYY109 pKa = 10.76GITVKK114 pKa = 10.43RR115 pKa = 11.84GRR117 pKa = 11.84VKK119 pKa = 10.93NEE121 pKa = 3.27YY122 pKa = 10.35LYY124 pKa = 11.19RR125 pKa = 11.84NANGAEE131 pKa = 3.96TWAGPKK137 pKa = 9.38HH138 pKa = 5.55HH139 pKa = 7.27AAMQRR144 pKa = 11.84CSIAGIRR151 pKa = 11.84NRR153 pKa = 11.84SGQVFNRR160 pKa = 11.84NDD162 pKa = 2.8WTGQRR167 pKa = 11.84RR168 pKa = 11.84TIGG171 pKa = 3.22
MM1 pKa = 7.73SIEE4 pKa = 4.08ATIMGYY10 pKa = 7.79FHH12 pKa = 7.55EE13 pKa = 4.93YY14 pKa = 9.34DD15 pKa = 3.25AKK17 pKa = 11.09ARR19 pKa = 11.84ALYY22 pKa = 8.74PAYY25 pKa = 10.18AARR28 pKa = 11.84PVPKK32 pKa = 10.29VSFFAKK38 pKa = 10.09GRR40 pKa = 11.84MNGWAKK46 pKa = 9.8QGSWEE51 pKa = 4.32VQFNTHH57 pKa = 6.11NASQVPEE64 pKa = 4.1EE65 pKa = 3.93FRR67 pKa = 11.84NTVSHH72 pKa = 7.09EE73 pKa = 3.78IAHH76 pKa = 5.65MVDD79 pKa = 3.0YY80 pKa = 10.9ALRR83 pKa = 11.84GRR85 pKa = 11.84SGHH88 pKa = 5.59DD89 pKa = 3.69RR90 pKa = 11.84IWKK93 pKa = 9.55AIHH96 pKa = 6.61RR97 pKa = 11.84SLGGTGTRR105 pKa = 11.84CSQYY109 pKa = 10.76GITVKK114 pKa = 10.43RR115 pKa = 11.84GRR117 pKa = 11.84VKK119 pKa = 10.93NEE121 pKa = 3.27YY122 pKa = 10.35LYY124 pKa = 11.19RR125 pKa = 11.84NANGAEE131 pKa = 3.96TWAGPKK137 pKa = 9.38HH138 pKa = 5.55HH139 pKa = 7.27AAMQRR144 pKa = 11.84CSIAGIRR151 pKa = 11.84NRR153 pKa = 11.84SGQVFNRR160 pKa = 11.84NDD162 pKa = 2.8WTGQRR167 pKa = 11.84RR168 pKa = 11.84TIGG171 pKa = 3.22
Molecular weight: 19.41 kDa
Isoelectric point according different methods:
Peptides (in silico digests for buttom-up proteomics)
Below you can find in silico digests of the whole proteome with Trypsin, Chymotrypsin, Trypsin+LysC, LysN, ArgC proteases suitable for different mass spec machines.| Try ESI |
 |
|---|
| ChTry ESI |
 |
|---|
| ArgC ESI |
 |
|---|
| LysN ESI |
 |
|---|
| TryLysC ESI |
 |
|---|
| Try MALDI |
 |
|---|
| ChTry MALDI |
 |
|---|
| ArgC MALDI |
 |
|---|
| LysN MALDI |
 |
|---|
| TryLysC MALDI |
 |
|---|
| Try LTQ |
 |
|---|
| ChTry LTQ |
 |
|---|
| ArgC LTQ |
 |
|---|
| LysN LTQ |
 |
|---|
| TryLysC LTQ |
 |
|---|
| Try MSlow |
 |
|---|
| ChTry MSlow |
 |
|---|
| ArgC MSlow |
 |
|---|
| LysN MSlow |
 |
|---|
| TryLysC MSlow |
 |
|---|
| Try MShigh |
 |
|---|
| ChTry MShigh |
 |
|---|
| ArgC MShigh |
 |
|---|
| LysN MShigh |
 |
|---|
| TryLysC MShigh |
 |
|---|
General Statistics
Number of major isoforms |
Number of additional isoforms |
Number of all proteins |
Number of amino acids |
Min. Seq. Length |
Max. Seq. Length |
Avg. Seq. Length |
Avg. Mol. Weight |
|---|---|---|---|---|---|---|---|
0 |
96337 |
35 |
3313 |
209.9 |
23.62 |
Amino acid frequency
Ala |
Cys |
Asp |
Glu |
Phe |
Gly |
His |
Ile |
Lys |
Leu |
|---|---|---|---|---|---|---|---|---|---|
7.473 ± 0.136 | 0.949 ± 0.049 |
6.409 ± 0.125 | 6.472 ± 0.216 |
4.389 ± 0.086 | 6.528 ± 0.154 |
2.005 ± 0.098 | 5.875 ± 0.087 |
6.222 ± 0.249 | 7.594 ± 0.163 |
Met |
Asn |
Gln |
Pro |
Arg |
Ser |
Thr |
Val |
Trp |
Tyr |
|---|---|---|---|---|---|---|---|---|---|
2.523 ± 0.078 | 5.122 ± 0.116 |
4.625 ± 0.185 | 3.439 ± 0.094 |
4.773 ± 0.113 | 6.078 ± 0.165 |
7.095 ± 0.408 | 6.775 ± 0.116 |
1.487 ± 0.06 | 4.167 ± 0.097 |
Most of the basic statistics you can see at this page can be downloaded from this CSV file
Proteome-pI is available under Creative Commons Attribution-NoDerivs license, for more details see here
| Reference: Kozlowski LP. Proteome-pI 2.0: Proteome Isoelectric Point Database Update. Nucleic Acids Res. 2021, doi: 10.1093/nar/gkab944 | Contact: Lukasz P. Kozlowski |
