Aspergillus carbonarius (strain ITEM 5010)
Taxonomy: cellular organisms; Eukaryota; Opisthokonta; Fungi; Dikarya; Ascomycota; saccharomyceta; Pezizomycotina; leotiomyceta; Eurotiomycetes; Eurotiomycetidae; Eurotiales; Aspergillaceae; Aspergillus; Aspergillus carbonarius
Average proteome isoelectric point is 6.35
Get precalculated fractions of proteins

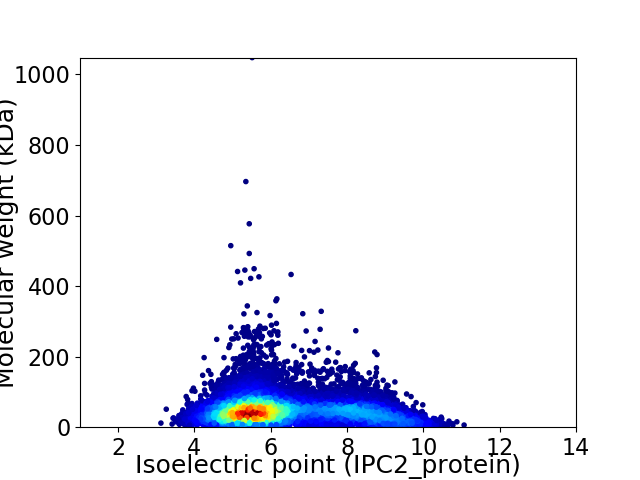
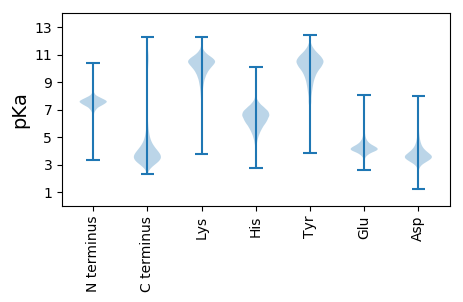
Virtual 2D-PAGE plot for 11037 proteins (isoelectric point calculated using IPC2_protein)
Get csv file with sequences according to given criteria:
* You can choose from 21 different methods for calculating isoelectric point
Summary statistics related to proteome-wise predictions


Protein with the lowest isoelectric point:
>tr|A0A1R3RM59|A0A1R3RM59_ASPC5 Glycoside hydrolase family 28 protein OS=Aspergillus carbonarius (strain ITEM 5010) OX=602072 GN=ASPCADRAFT_507388 PE=3 SV=1
DDD2 pKa = 4.18DD3 pKa = 4.43GDDD6 pKa = 4.1DD7 pKa = 3.92GDDD10 pKa = 3.93DD11 pKa = 4.05GDDD14 pKa = 3.7DD15 pKa = 3.98GDDD18 pKa = 3.76DD19 pKa = 3.88GDDD22 pKa = 3.55DD23 pKa = 3.93GDDD26 pKa = 3.5DD27 pKa = 4.02GDDD30 pKa = 3.58DD31 pKa = 4.0ADDD34 pKa = 3.8DD35 pKa = 4.33DDD37 pKa = 5.08DD38 pKa = 4.28EE39 pKa = 6.15DDD41 pKa = 4.36DD42 pKa = 3.85EE43 pKa = 5.56GDDD46 pKa = 3.59EE47 pKa = 4.42GDDD50 pKa = 3.88NGSDDD55 pKa = 3.2GSATATPSAASSTYYY70 pKa = 10.16APAASSSAAVSNGEEE85 pKa = 4.15CSPQCTEEE93 pKa = 4.67LSNDDD98 pKa = 3.4TDDD101 pKa = 3.57SSTSFRR107 pKa = 11.84RR108 pKa = 11.84SGLFSRR114 pKa = 11.84GLTRR118 pKa = 11.84RR119 pKa = 11.84LSNYYY124 pKa = 7.07TWMLEEE130 pKa = 3.87MRR132 pKa = 11.84SGQLLAKKK140 pKa = 8.59DD141 pKa = 3.69SGMSTSEEE149 pKa = 3.99VVFGSGSTIFGQTNIRR165 pKa = 11.84GCTVVIVVSKKK176 pKa = 9.03YY177 pKa = 10.75VYYY180 pKa = 9.76AHHH183 pKa = 6.74WEEE186 pKa = 4.89PGFVTNQNGTVSFNEEE202 pKa = 3.97GFQTTVLDDD211 pKa = 5.06LTKKK215 pKa = 10.57DD216 pKa = 3.93NLKKK220 pKa = 9.27PQLTGSTAYYY230 pKa = 9.25DDD232 pKa = 4.44GTQVYYY238 pKa = 10.26GTPVDDD244 pKa = 3.52TGQGAKKK251 pKa = 9.92YY252 pKa = 9.77SQISQVTATINSVLGLSTDDD272 pKa = 3.24SEEE275 pKa = 4.54YY276 pKa = 10.66YY277 pKa = 9.05YY278 pKa = 8.54TTSTDDD284 pKa = 3.39QGKKK288 pKa = 8.09LFTYYY293 pKa = 10.15ANTCNKKK300 pKa = 9.37VWQVWYYY307 pKa = 10.83DDD309 pKa = 3.71SSNALWSSSEEE320 pKa = 4.14SSCAASASITPSRR333 pKa = 11.84TAALPAYYY341 pKa = 8.6EEE343 pKa = 4.16STFRR347 pKa = 11.84VLPKKK352 pKa = 8.18TPSY
DDD2 pKa = 4.18DD3 pKa = 4.43GDDD6 pKa = 4.1DD7 pKa = 3.92GDDD10 pKa = 3.93DD11 pKa = 4.05GDDD14 pKa = 3.7DD15 pKa = 3.98GDDD18 pKa = 3.76DD19 pKa = 3.88GDDD22 pKa = 3.55DD23 pKa = 3.93GDDD26 pKa = 3.5DD27 pKa = 4.02GDDD30 pKa = 3.58DD31 pKa = 4.0ADDD34 pKa = 3.8DD35 pKa = 4.33DDD37 pKa = 5.08DD38 pKa = 4.28EE39 pKa = 6.15DDD41 pKa = 4.36DD42 pKa = 3.85EE43 pKa = 5.56GDDD46 pKa = 3.59EE47 pKa = 4.42GDDD50 pKa = 3.88NGSDDD55 pKa = 3.2GSATATPSAASSTYYY70 pKa = 10.16APAASSSAAVSNGEEE85 pKa = 4.15CSPQCTEEE93 pKa = 4.67LSNDDD98 pKa = 3.4TDDD101 pKa = 3.57SSTSFRR107 pKa = 11.84RR108 pKa = 11.84SGLFSRR114 pKa = 11.84GLTRR118 pKa = 11.84RR119 pKa = 11.84LSNYYY124 pKa = 7.07TWMLEEE130 pKa = 3.87MRR132 pKa = 11.84SGQLLAKKK140 pKa = 8.59DD141 pKa = 3.69SGMSTSEEE149 pKa = 3.99VVFGSGSTIFGQTNIRR165 pKa = 11.84GCTVVIVVSKKK176 pKa = 9.03YY177 pKa = 10.75VYYY180 pKa = 9.76AHHH183 pKa = 6.74WEEE186 pKa = 4.89PGFVTNQNGTVSFNEEE202 pKa = 3.97GFQTTVLDDD211 pKa = 5.06LTKKK215 pKa = 10.57DD216 pKa = 3.93NLKKK220 pKa = 9.27PQLTGSTAYYY230 pKa = 9.25DDD232 pKa = 4.44GTQVYYY238 pKa = 10.26GTPVDDD244 pKa = 3.52TGQGAKKK251 pKa = 9.92YY252 pKa = 9.77SQISQVTATINSVLGLSTDDD272 pKa = 3.24SEEE275 pKa = 4.54YY276 pKa = 10.66YY277 pKa = 9.05YY278 pKa = 8.54TTSTDDD284 pKa = 3.39QGKKK288 pKa = 8.09LFTYYY293 pKa = 10.15ANTCNKKK300 pKa = 9.37VWQVWYYY307 pKa = 10.83DDD309 pKa = 3.71SSNALWSSSEEE320 pKa = 4.14SSCAASASITPSRR333 pKa = 11.84TAALPAYYY341 pKa = 8.6EEE343 pKa = 4.16STFRR347 pKa = 11.84VLPKKK352 pKa = 8.18TPSY
Molecular weight: 37.48 kDa
Isoelectric point according different methods:
Protein with the highest isoelectric point:
>tr|A0A1R3RG69|A0A1R3RG69_ASPC5 Uncharacterized protein OS=Aspergillus carbonarius (strain ITEM 5010) OX=602072 GN=ASPCADRAFT_7695 PE=4 SV=1
MM1 pKa = 7.18YY2 pKa = 10.64GRR4 pKa = 11.84VANQGSRR11 pKa = 11.84SGRR14 pKa = 11.84PPSIHH19 pKa = 6.3QSSAAAAVIRR29 pKa = 11.84RR30 pKa = 11.84RR31 pKa = 11.84VNFPRR36 pKa = 11.84SQAMRR41 pKa = 11.84IKK43 pKa = 10.44RR44 pKa = 11.84ALPGIGFRR52 pKa = 11.84ASPPP56 pKa = 3.38
MM1 pKa = 7.18YY2 pKa = 10.64GRR4 pKa = 11.84VANQGSRR11 pKa = 11.84SGRR14 pKa = 11.84PPSIHH19 pKa = 6.3QSSAAAAVIRR29 pKa = 11.84RR30 pKa = 11.84RR31 pKa = 11.84VNFPRR36 pKa = 11.84SQAMRR41 pKa = 11.84IKK43 pKa = 10.44RR44 pKa = 11.84ALPGIGFRR52 pKa = 11.84ASPPP56 pKa = 3.38
Molecular weight: 6.09 kDa
Isoelectric point according different methods:
Peptides (in silico digests for buttom-up proteomics)
Below you can find in silico digests of the whole proteome with Trypsin, Chymotrypsin, Trypsin+LysC, LysN, ArgC proteases suitable for different mass spec machines.| Try ESI |
 |
|---|
| ChTry ESI |
 |
|---|
| ArgC ESI |
 |
|---|
| LysN ESI |
 |
|---|
| TryLysC ESI |
 |
|---|
| Try MALDI |
 |
|---|
| ChTry MALDI |
 |
|---|
| ArgC MALDI |
 |
|---|
| LysN MALDI |
 |
|---|
| TryLysC MALDI |
 |
|---|
| Try LTQ |
 |
|---|
| ChTry LTQ |
 |
|---|
| ArgC LTQ |
 |
|---|
| LysN LTQ |
 |
|---|
| TryLysC LTQ |
 |
|---|
| Try MSlow |
 |
|---|
| ChTry MSlow |
 |
|---|
| ArgC MSlow |
 |
|---|
| LysN MSlow |
 |
|---|
| TryLysC MSlow |
 |
|---|
| Try MShigh |
 |
|---|
| ChTry MShigh |
 |
|---|
| ArgC MShigh |
 |
|---|
| LysN MShigh |
 |
|---|
| TryLysC MShigh |
 |
|---|
General Statistics
Number of major isoforms |
Number of additional isoforms |
Number of all proteins |
Number of amino acids |
Min. Seq. Length |
Max. Seq. Length |
Avg. Seq. Length |
Avg. Mol. Weight |
|---|---|---|---|---|---|---|---|
5099753 |
42 |
9610 |
462.1 |
51.2 |
Amino acid frequency
Ala |
Cys |
Asp |
Glu |
Phe |
Gly |
His |
Ile |
Lys |
Leu |
|---|---|---|---|---|---|---|---|---|---|
8.449 ± 0.02 | 1.318 ± 0.008 |
5.587 ± 0.018 | 5.941 ± 0.02 |
3.825 ± 0.015 | 6.888 ± 0.02 |
2.498 ± 0.011 | 5.075 ± 0.016 |
4.239 ± 0.021 | 9.391 ± 0.025 |
Met |
Asn |
Gln |
Pro |
Arg |
Ser |
Thr |
Val |
Trp |
Tyr |
|---|---|---|---|---|---|---|---|---|---|
2.203 ± 0.008 | 3.504 ± 0.011 |
5.952 ± 0.02 | 3.963 ± 0.014 |
6.125 ± 0.019 | 8.125 ± 0.028 |
6.028 ± 0.014 | 6.378 ± 0.017 |
1.552 ± 0.009 | 2.957 ± 0.013 |
Most of the basic statistics you can see at this page can be downloaded from this CSV file
Proteome-pI is available under Creative Commons Attribution-NoDerivs license, for more details see here
| Reference: Kozlowski LP. Proteome-pI 2.0: Proteome Isoelectric Point Database Update. Nucleic Acids Res. 2021, doi: 10.1093/nar/gkab944 | Contact: Lukasz P. Kozlowski |
