Finegoldia magna (strain ATCC 29328 / DSM 20472 / WAL 2508) (Peptostreptococcus magnus)
Taxonomy: cellular organisms; Bacteria; Terrabacteria group; Firmicutes; Tissierellia; Tissierellales; Peptoniphilaceae; Finegoldia; Finegoldia magna
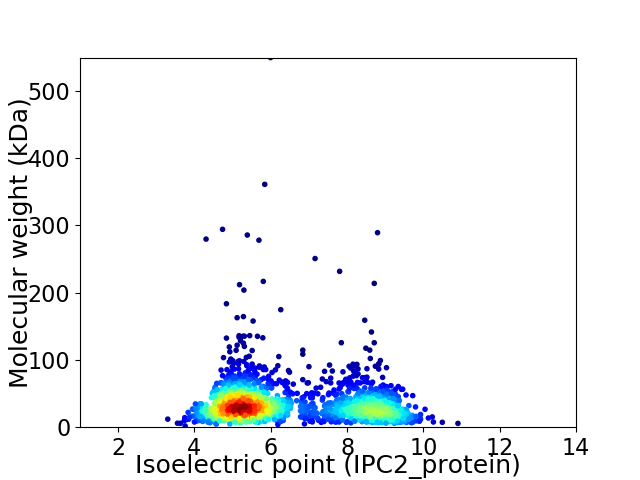
Average proteome isoelectric point is 6.43
Get precalculated fractions of proteins

Virtual 2D-PAGE plot for 1813 proteins (isoelectric point calculated using IPC2_protein)
Get csv file with sequences according to given criteria:
* You can choose from 21 different methods for calculating isoelectric point
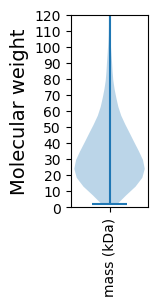
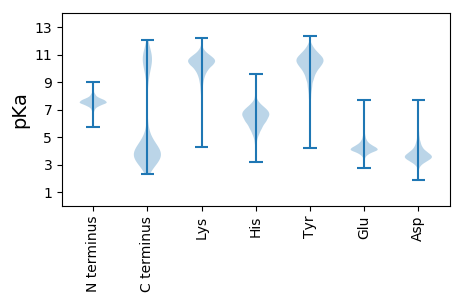
Summary statistics related to proteome-wise predictions


Protein with the lowest isoelectric point:
>tr|B0S4D2|B0S4D2_FINM2 dUTP diphosphatase OS=Finegoldia magna (strain ATCC 29328 / DSM 20472 / WAL 2508) OX=334413 GN=FMG_P0074 PE=4 SV=1
MM1 pKa = 7.22TNEE4 pKa = 4.29LKK6 pKa = 10.35PYY8 pKa = 10.21EE9 pKa = 4.49KK10 pKa = 9.84IKK12 pKa = 10.64EE13 pKa = 3.99YY14 pKa = 10.11TVNGKK19 pKa = 9.38PYY21 pKa = 10.67DD22 pKa = 3.78EE23 pKa = 4.81GLEE26 pKa = 3.99DD27 pKa = 5.13LYY29 pKa = 11.55LYY31 pKa = 10.55LQATASIDD39 pKa = 3.22YY40 pKa = 8.83TIYY43 pKa = 11.18VDD45 pKa = 5.39IEE47 pKa = 4.28TGDD50 pKa = 3.51IDD52 pKa = 5.79AMPSCDD58 pKa = 5.32FGNAYY63 pKa = 10.93YY64 pKa = 10.52NINKK68 pKa = 10.22AIFNWKK74 pKa = 9.54VNGGEE79 pKa = 3.82PWLGEE84 pKa = 4.01VYY86 pKa = 10.06TYY88 pKa = 11.43DD89 pKa = 3.48EE90 pKa = 5.07LEE92 pKa = 4.87DD93 pKa = 3.91YY94 pKa = 11.12ACEE97 pKa = 3.97EE98 pKa = 4.21DD99 pKa = 3.91VKK101 pKa = 10.59EE102 pKa = 3.87LRR104 pKa = 11.84KK105 pKa = 10.18EE106 pKa = 3.86FEE108 pKa = 4.23EE109 pKa = 4.13EE110 pKa = 3.89HH111 pKa = 7.59KK112 pKa = 11.17EE113 pKa = 3.98EE114 pKa = 4.4LDD116 pKa = 3.57EE117 pKa = 5.04YY118 pKa = 11.37EE119 pKa = 5.63DD120 pKa = 5.52IEE122 pKa = 5.58DD123 pKa = 4.92FYY125 pKa = 11.87NDD127 pKa = 3.16FANDD131 pKa = 3.31YY132 pKa = 11.14KK133 pKa = 11.23EE134 pKa = 3.95FLFYY138 pKa = 11.27AEE140 pKa = 5.4NEE142 pKa = 4.59DD143 pKa = 3.14IDD145 pKa = 4.28KK146 pKa = 11.37GVDD149 pKa = 2.98EE150 pKa = 5.21FARR153 pKa = 11.84EE154 pKa = 4.2SLDD157 pKa = 3.1SWKK160 pKa = 10.81EE161 pKa = 3.85DD162 pKa = 4.21FEE164 pKa = 4.43NAYY167 pKa = 10.6CKK169 pKa = 10.59LLEE172 pKa = 4.71DD173 pKa = 3.88YY174 pKa = 10.37EE175 pKa = 4.29LRR177 pKa = 11.84EE178 pKa = 4.04EE179 pKa = 4.59LEE181 pKa = 4.8DD182 pKa = 3.84YY183 pKa = 11.21
MM1 pKa = 7.22TNEE4 pKa = 4.29LKK6 pKa = 10.35PYY8 pKa = 10.21EE9 pKa = 4.49KK10 pKa = 9.84IKK12 pKa = 10.64EE13 pKa = 3.99YY14 pKa = 10.11TVNGKK19 pKa = 9.38PYY21 pKa = 10.67DD22 pKa = 3.78EE23 pKa = 4.81GLEE26 pKa = 3.99DD27 pKa = 5.13LYY29 pKa = 11.55LYY31 pKa = 10.55LQATASIDD39 pKa = 3.22YY40 pKa = 8.83TIYY43 pKa = 11.18VDD45 pKa = 5.39IEE47 pKa = 4.28TGDD50 pKa = 3.51IDD52 pKa = 5.79AMPSCDD58 pKa = 5.32FGNAYY63 pKa = 10.93YY64 pKa = 10.52NINKK68 pKa = 10.22AIFNWKK74 pKa = 9.54VNGGEE79 pKa = 3.82PWLGEE84 pKa = 4.01VYY86 pKa = 10.06TYY88 pKa = 11.43DD89 pKa = 3.48EE90 pKa = 5.07LEE92 pKa = 4.87DD93 pKa = 3.91YY94 pKa = 11.12ACEE97 pKa = 3.97EE98 pKa = 4.21DD99 pKa = 3.91VKK101 pKa = 10.59EE102 pKa = 3.87LRR104 pKa = 11.84KK105 pKa = 10.18EE106 pKa = 3.86FEE108 pKa = 4.23EE109 pKa = 4.13EE110 pKa = 3.89HH111 pKa = 7.59KK112 pKa = 11.17EE113 pKa = 3.98EE114 pKa = 4.4LDD116 pKa = 3.57EE117 pKa = 5.04YY118 pKa = 11.37EE119 pKa = 5.63DD120 pKa = 5.52IEE122 pKa = 5.58DD123 pKa = 4.92FYY125 pKa = 11.87NDD127 pKa = 3.16FANDD131 pKa = 3.31YY132 pKa = 11.14KK133 pKa = 11.23EE134 pKa = 3.95FLFYY138 pKa = 11.27AEE140 pKa = 5.4NEE142 pKa = 4.59DD143 pKa = 3.14IDD145 pKa = 4.28KK146 pKa = 11.37GVDD149 pKa = 2.98EE150 pKa = 5.21FARR153 pKa = 11.84EE154 pKa = 4.2SLDD157 pKa = 3.1SWKK160 pKa = 10.81EE161 pKa = 3.85DD162 pKa = 4.21FEE164 pKa = 4.43NAYY167 pKa = 10.6CKK169 pKa = 10.59LLEE172 pKa = 4.71DD173 pKa = 3.88YY174 pKa = 10.37EE175 pKa = 4.29LRR177 pKa = 11.84EE178 pKa = 4.04EE179 pKa = 4.59LEE181 pKa = 4.8DD182 pKa = 3.84YY183 pKa = 11.21
Molecular weight: 21.97 kDa
Isoelectric point according different methods:
Protein with the highest isoelectric point:
>tr|B0S3X3|B0S3X3_FINM2 Uncharacterized protein OS=Finegoldia magna (strain ATCC 29328 / DSM 20472 / WAL 2508) OX=334413 GN=FMG_0329 PE=4 SV=1
MM1 pKa = 7.75RR2 pKa = 11.84LMKK5 pKa = 9.87RR6 pKa = 11.84TYY8 pKa = 10.02QPNNRR13 pKa = 11.84KK14 pKa = 9.34RR15 pKa = 11.84KK16 pKa = 8.55KK17 pKa = 10.22DD18 pKa = 3.02HH19 pKa = 6.06GFRR22 pKa = 11.84NRR24 pKa = 11.84MATRR28 pKa = 11.84GGRR31 pKa = 11.84AVLKK35 pKa = 10.23ARR37 pKa = 11.84RR38 pKa = 11.84RR39 pKa = 11.84KK40 pKa = 8.76GRR42 pKa = 11.84KK43 pKa = 8.75VLSAA47 pKa = 4.05
MM1 pKa = 7.75RR2 pKa = 11.84LMKK5 pKa = 9.87RR6 pKa = 11.84TYY8 pKa = 10.02QPNNRR13 pKa = 11.84KK14 pKa = 9.34RR15 pKa = 11.84KK16 pKa = 8.55KK17 pKa = 10.22DD18 pKa = 3.02HH19 pKa = 6.06GFRR22 pKa = 11.84NRR24 pKa = 11.84MATRR28 pKa = 11.84GGRR31 pKa = 11.84AVLKK35 pKa = 10.23ARR37 pKa = 11.84RR38 pKa = 11.84RR39 pKa = 11.84KK40 pKa = 8.76GRR42 pKa = 11.84KK43 pKa = 8.75VLSAA47 pKa = 4.05
Molecular weight: 5.65 kDa
Isoelectric point according different methods:
Peptides (in silico digests for buttom-up proteomics)
Below you can find in silico digests of the whole proteome with Trypsin, Chymotrypsin, Trypsin+LysC, LysN, ArgC proteases suitable for different mass spec machines.| Try ESI |
 |
|---|
| ChTry ESI |
 |
|---|
| ArgC ESI |
 |
|---|
| LysN ESI |
 |
|---|
| TryLysC ESI |
 |
|---|
| Try MALDI |
 |
|---|
| ChTry MALDI |
 |
|---|
| ArgC MALDI |
 |
|---|
| LysN MALDI |
 |
|---|
| TryLysC MALDI |
 |
|---|
| Try LTQ |
 |
|---|
| ChTry LTQ |
 |
|---|
| ArgC LTQ |
 |
|---|
| LysN LTQ |
 |
|---|
| TryLysC LTQ |
 |
|---|
| Try MSlow |
 |
|---|
| ChTry MSlow |
 |
|---|
| ArgC MSlow |
 |
|---|
| LysN MSlow |
 |
|---|
| TryLysC MSlow |
 |
|---|
| Try MShigh |
 |
|---|
| ChTry MShigh |
 |
|---|
| ArgC MShigh |
 |
|---|
| LysN MShigh |
 |
|---|
| TryLysC MShigh |
 |
|---|
General Statistics
Number of major isoforms |
Number of additional isoforms |
Number of all proteins |
Number of amino acids |
Min. Seq. Length |
Max. Seq. Length |
Avg. Seq. Length |
Avg. Mol. Weight |
|---|---|---|---|---|---|---|---|
0 |
596766 |
16 |
4919 |
329.2 |
37.43 |
Amino acid frequency
Ala |
Cys |
Asp |
Glu |
Phe |
Gly |
His |
Ile |
Lys |
Leu |
|---|---|---|---|---|---|---|---|---|---|
5.099 ± 0.059 | 1.009 ± 0.025 |
6.662 ± 0.068 | 7.403 ± 0.075 |
4.627 ± 0.057 | 5.702 ± 0.053 |
1.33 ± 0.018 | 9.231 ± 0.078 |
9.772 ± 0.079 | 8.841 ± 0.079 |
Met |
Asn |
Gln |
Pro |
Arg |
Ser |
Thr |
Val |
Trp |
Tyr |
|---|---|---|---|---|---|---|---|---|---|
2.653 ± 0.034 | 6.486 ± 0.053 |
2.665 ± 0.039 | 2.633 ± 0.032 |
3.372 ± 0.039 | 6.272 ± 0.051 |
5.027 ± 0.066 | 6.501 ± 0.043 |
0.548 ± 0.016 | 4.167 ± 0.043 |
Most of the basic statistics you can see at this page can be downloaded from this CSV file
Proteome-pI is available under Creative Commons Attribution-NoDerivs license, for more details see here
| Reference: Kozlowski LP. Proteome-pI 2.0: Proteome Isoelectric Point Database Update. Nucleic Acids Res. 2021, doi: 10.1093/nar/gkab944 | Contact: Lukasz P. Kozlowski |
