Azospirillum baldaniorum
Taxonomy: cellular organisms; Bacteria; Proteobacteria; Alphaproteobacteria; Rhodospirillales; Azospirillaceae; Azospirillum
Average proteome isoelectric point is 6.87
Get precalculated fractions of proteins

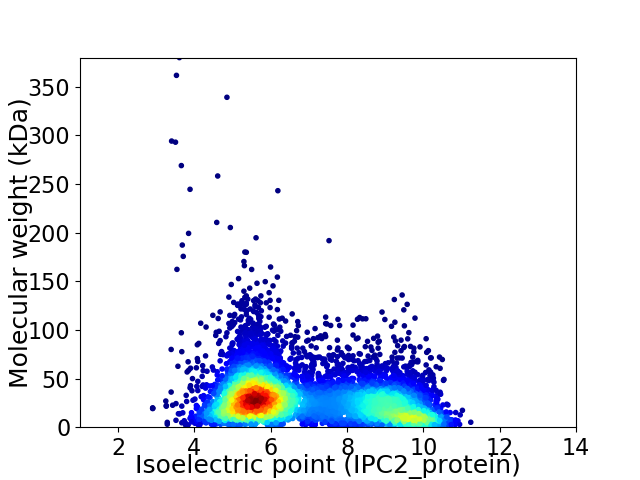
Virtual 2D-PAGE plot for 7541 proteins (isoelectric point calculated using IPC2_protein)
Get csv file with sequences according to given criteria:
* You can choose from 21 different methods for calculating isoelectric point
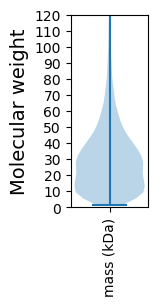
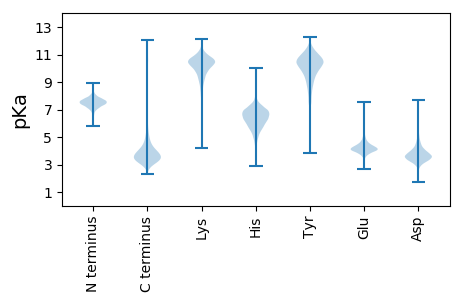
Summary statistics related to proteome-wise predictions


Protein with the lowest isoelectric point:
>tr|G8AYJ0|G8AYJ0_9PROT Uncharacterized protein OS=Azospirillum baldaniorum OX=1064539 GN=AZOBR_p340187 PE=4 SV=1
MM1 pKa = 7.65NEE3 pKa = 3.97EE4 pKa = 4.1FQTAAADD11 pKa = 3.44SGLAIQGAINRR22 pKa = 11.84LGLYY26 pKa = 9.58IGSPDD31 pKa = 3.94IYY33 pKa = 10.21PGLPVQEE40 pKa = 4.32PVVPAPAGRR49 pKa = 11.84PIALAQQAALDD60 pKa = 3.93AVAAAIAGVAALLVDD75 pKa = 4.02MVGDD79 pKa = 3.76PAVTPYY85 pKa = 10.08EE86 pKa = 4.25VPGLSLPGADD96 pKa = 2.8VATYY100 pKa = 10.53LGLITSEE107 pKa = 4.58HH108 pKa = 6.62ASQPLYY114 pKa = 10.44RR115 pKa = 11.84AALTALLKK123 pKa = 10.4PLSDD127 pKa = 3.86GQGSFAGLADD137 pKa = 4.35RR138 pKa = 11.84FDD140 pKa = 4.71LDD142 pKa = 4.27RR143 pKa = 11.84AVGDD147 pKa = 3.58QLDD150 pKa = 4.47TIGLWVGASRR160 pKa = 11.84RR161 pKa = 11.84LTVPLTGVYY170 pKa = 10.4FSFDD174 pKa = 3.22TAGVGFDD181 pKa = 3.53QGSWWAVGDD190 pKa = 3.55PTGYY194 pKa = 8.88LTVLPDD200 pKa = 3.65DD201 pKa = 5.16GYY203 pKa = 10.05RR204 pKa = 11.84TLIRR208 pKa = 11.84ARR210 pKa = 11.84IAANAWDD217 pKa = 3.89GTIPGAYY224 pKa = 9.4AVWDD228 pKa = 3.4IAFAGTGYY236 pKa = 10.75SVLIQDD242 pKa = 4.38NQNMTMDD249 pKa = 4.58FALLGPSPDD258 pKa = 3.56AVTLALFTGGYY269 pKa = 10.14LNVRR273 pKa = 11.84PAGVAVNAYY282 pKa = 5.57WTQSVPDD289 pKa = 3.73TPYY292 pKa = 10.78FGFDD296 pKa = 3.25AADD299 pKa = 3.36SGIAGFDD306 pKa = 3.18VGAWGLPTSPP316 pKa = 4.65
MM1 pKa = 7.65NEE3 pKa = 3.97EE4 pKa = 4.1FQTAAADD11 pKa = 3.44SGLAIQGAINRR22 pKa = 11.84LGLYY26 pKa = 9.58IGSPDD31 pKa = 3.94IYY33 pKa = 10.21PGLPVQEE40 pKa = 4.32PVVPAPAGRR49 pKa = 11.84PIALAQQAALDD60 pKa = 3.93AVAAAIAGVAALLVDD75 pKa = 4.02MVGDD79 pKa = 3.76PAVTPYY85 pKa = 10.08EE86 pKa = 4.25VPGLSLPGADD96 pKa = 2.8VATYY100 pKa = 10.53LGLITSEE107 pKa = 4.58HH108 pKa = 6.62ASQPLYY114 pKa = 10.44RR115 pKa = 11.84AALTALLKK123 pKa = 10.4PLSDD127 pKa = 3.86GQGSFAGLADD137 pKa = 4.35RR138 pKa = 11.84FDD140 pKa = 4.71LDD142 pKa = 4.27RR143 pKa = 11.84AVGDD147 pKa = 3.58QLDD150 pKa = 4.47TIGLWVGASRR160 pKa = 11.84RR161 pKa = 11.84LTVPLTGVYY170 pKa = 10.4FSFDD174 pKa = 3.22TAGVGFDD181 pKa = 3.53QGSWWAVGDD190 pKa = 3.55PTGYY194 pKa = 8.88LTVLPDD200 pKa = 3.65DD201 pKa = 5.16GYY203 pKa = 10.05RR204 pKa = 11.84TLIRR208 pKa = 11.84ARR210 pKa = 11.84IAANAWDD217 pKa = 3.89GTIPGAYY224 pKa = 9.4AVWDD228 pKa = 3.4IAFAGTGYY236 pKa = 10.75SVLIQDD242 pKa = 4.38NQNMTMDD249 pKa = 4.58FALLGPSPDD258 pKa = 3.56AVTLALFTGGYY269 pKa = 10.14LNVRR273 pKa = 11.84PAGVAVNAYY282 pKa = 5.57WTQSVPDD289 pKa = 3.73TPYY292 pKa = 10.78FGFDD296 pKa = 3.25AADD299 pKa = 3.36SGIAGFDD306 pKa = 3.18VGAWGLPTSPP316 pKa = 4.65
Molecular weight: 32.74 kDa
Isoelectric point according different methods:
Protein with the highest isoelectric point:
>tr|G8AI80|G8AI80_9PROT Glycosyl transferase OS=Azospirillum baldaniorum OX=1064539 GN=AZOBR_40152 PE=4 SV=1
MM1 pKa = 7.45KK2 pKa = 9.59RR3 pKa = 11.84TFQPSKK9 pKa = 8.96IVRR12 pKa = 11.84KK13 pKa = 9.24RR14 pKa = 11.84RR15 pKa = 11.84HH16 pKa = 4.55GFRR19 pKa = 11.84ARR21 pKa = 11.84MATVGGRR28 pKa = 11.84KK29 pKa = 9.3VIARR33 pKa = 11.84RR34 pKa = 11.84RR35 pKa = 11.84AKK37 pKa = 10.29GRR39 pKa = 11.84SVLSAA44 pKa = 3.74
MM1 pKa = 7.45KK2 pKa = 9.59RR3 pKa = 11.84TFQPSKK9 pKa = 8.96IVRR12 pKa = 11.84KK13 pKa = 9.24RR14 pKa = 11.84RR15 pKa = 11.84HH16 pKa = 4.55GFRR19 pKa = 11.84ARR21 pKa = 11.84MATVGGRR28 pKa = 11.84KK29 pKa = 9.3VIARR33 pKa = 11.84RR34 pKa = 11.84RR35 pKa = 11.84AKK37 pKa = 10.29GRR39 pKa = 11.84SVLSAA44 pKa = 3.74
Molecular weight: 5.08 kDa
Isoelectric point according different methods:
Peptides (in silico digests for buttom-up proteomics)
Below you can find in silico digests of the whole proteome with Trypsin, Chymotrypsin, Trypsin+LysC, LysN, ArgC proteases suitable for different mass spec machines.| Try ESI |
 |
|---|
| ChTry ESI |
 |
|---|
| ArgC ESI |
 |
|---|
| LysN ESI |
 |
|---|
| TryLysC ESI |
 |
|---|
| Try MALDI |
 |
|---|
| ChTry MALDI |
 |
|---|
| ArgC MALDI |
 |
|---|
| LysN MALDI |
 |
|---|
| TryLysC MALDI |
 |
|---|
| Try LTQ |
 |
|---|
| ChTry LTQ |
 |
|---|
| ArgC LTQ |
 |
|---|
| LysN LTQ |
 |
|---|
| TryLysC LTQ |
 |
|---|
| Try MSlow |
 |
|---|
| ChTry MSlow |
 |
|---|
| ArgC MSlow |
 |
|---|
| LysN MSlow |
 |
|---|
| TryLysC MSlow |
 |
|---|
| Try MShigh |
 |
|---|
| ChTry MShigh |
 |
|---|
| ArgC MShigh |
 |
|---|
| LysN MShigh |
 |
|---|
| TryLysC MShigh |
 |
|---|
General Statistics
Number of major isoforms |
Number of additional isoforms |
Number of all proteins |
Number of amino acids |
Min. Seq. Length |
Max. Seq. Length |
Avg. Seq. Length |
Avg. Mol. Weight |
|---|---|---|---|---|---|---|---|
0 |
2208573 |
13 |
3900 |
292.9 |
31.57 |
Amino acid frequency
Ala |
Cys |
Asp |
Glu |
Phe |
Gly |
His |
Ile |
Lys |
Leu |
|---|---|---|---|---|---|---|---|---|---|
13.129 ± 0.041 | 0.87 ± 0.01 |
5.701 ± 0.022 | 5.375 ± 0.029 |
3.323 ± 0.02 | 9.135 ± 0.035 |
2.117 ± 0.018 | 4.23 ± 0.02 |
2.677 ± 0.022 | 10.446 ± 0.038 |
Met |
Asn |
Gln |
Pro |
Arg |
Ser |
Thr |
Val |
Trp |
Tyr |
|---|---|---|---|---|---|---|---|---|---|
2.336 ± 0.015 | 2.398 ± 0.023 |
5.788 ± 0.029 | 3.005 ± 0.018 |
8.009 ± 0.044 | 5.024 ± 0.027 |
5.501 ± 0.048 | 7.667 ± 0.025 |
1.324 ± 0.015 | 1.945 ± 0.015 |
Most of the basic statistics you can see at this page can be downloaded from this CSV file
Proteome-pI is available under Creative Commons Attribution-NoDerivs license, for more details see here
| Reference: Kozlowski LP. Proteome-pI 2.0: Proteome Isoelectric Point Database Update. Nucleic Acids Res. 2021, doi: 10.1093/nar/gkab944 | Contact: Lukasz P. Kozlowski |
