Limnobacter sp. MED105
Taxonomy: cellular organisms; Bacteria; Proteobacteria; Betaproteobacteria; Burkholderiales; Burkholderiaceae; Limnobacter; unclassified Limnobacter
Average proteome isoelectric point is 6.52
Get precalculated fractions of proteins
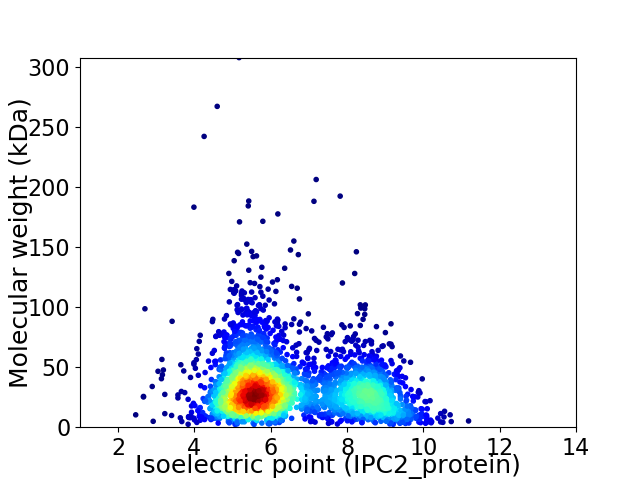
Virtual 2D-PAGE plot for 3244 proteins (isoelectric point calculated using IPC2_protein)
Get csv file with sequences according to given criteria:
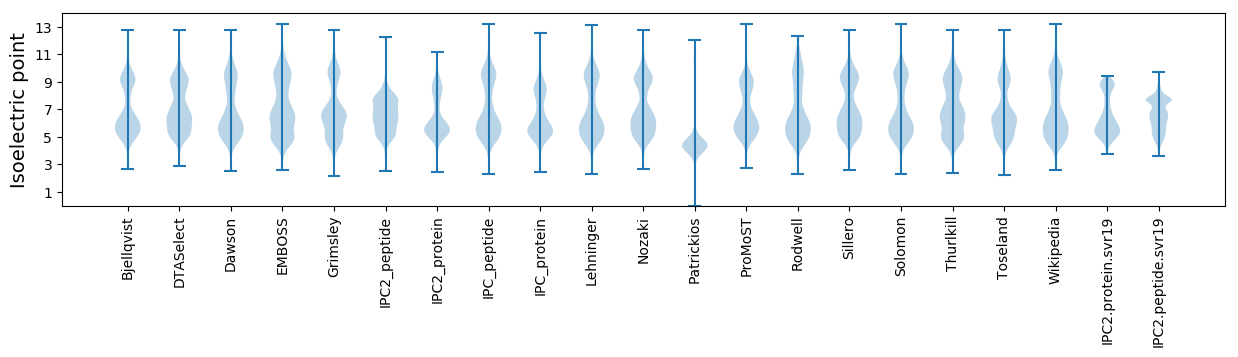
* You can choose from 21 different methods for calculating isoelectric point
Summary statistics related to proteome-wise predictions
Protein with the lowest isoelectric point:
>tr|A6GMT0|A6GMT0_9BURK YapH protein OS=Limnobacter sp. MED105 OX=391597 GN=LMED105_03025 PE=4 SV=1
MM1 pKa = 7.51AQFDD5 pKa = 4.54PNAPPALFMPPADD18 pKa = 3.9MAHH21 pKa = 7.37DD22 pKa = 4.44IYY24 pKa = 11.47ALSSQLEE31 pKa = 4.43GFDD34 pKa = 3.44HH35 pKa = 7.35NMYY38 pKa = 10.74QDD40 pKa = 3.31IQQDD44 pKa = 3.54QAVYY48 pKa = 10.85DD49 pKa = 3.97SFQRR53 pKa = 11.84WPFLFGIAMASRR65 pKa = 11.84FSEE68 pKa = 4.45DD69 pKa = 2.62
MM1 pKa = 7.51AQFDD5 pKa = 4.54PNAPPALFMPPADD18 pKa = 3.9MAHH21 pKa = 7.37DD22 pKa = 4.44IYY24 pKa = 11.47ALSSQLEE31 pKa = 4.43GFDD34 pKa = 3.44HH35 pKa = 7.35NMYY38 pKa = 10.74QDD40 pKa = 3.31IQQDD44 pKa = 3.54QAVYY48 pKa = 10.85DD49 pKa = 3.97SFQRR53 pKa = 11.84WPFLFGIAMASRR65 pKa = 11.84FSEE68 pKa = 4.45DD69 pKa = 2.62
Molecular weight: 7.93 kDa
Isoelectric point according different methods:
Protein with the highest isoelectric point:
>tr|A6GL94|A6GL94_9BURK AAA_15 domain-containing protein OS=Limnobacter sp. MED105 OX=391597 GN=LMED105_04482 PE=4 SV=1
MM1 pKa = 7.35KK2 pKa = 9.43RR3 pKa = 11.84TYY5 pKa = 10.25QPSKK9 pKa = 9.63VRR11 pKa = 11.84RR12 pKa = 11.84QRR14 pKa = 11.84THH16 pKa = 5.6GFLVRR21 pKa = 11.84SRR23 pKa = 11.84TRR25 pKa = 11.84GGRR28 pKa = 11.84AVLRR32 pKa = 11.84ARR34 pKa = 11.84RR35 pKa = 11.84SKK37 pKa = 10.48GRR39 pKa = 11.84ARR41 pKa = 11.84LSVV44 pKa = 3.12
MM1 pKa = 7.35KK2 pKa = 9.43RR3 pKa = 11.84TYY5 pKa = 10.25QPSKK9 pKa = 9.63VRR11 pKa = 11.84RR12 pKa = 11.84QRR14 pKa = 11.84THH16 pKa = 5.6GFLVRR21 pKa = 11.84SRR23 pKa = 11.84TRR25 pKa = 11.84GGRR28 pKa = 11.84AVLRR32 pKa = 11.84ARR34 pKa = 11.84RR35 pKa = 11.84SKK37 pKa = 10.48GRR39 pKa = 11.84ARR41 pKa = 11.84LSVV44 pKa = 3.12
Molecular weight: 5.19 kDa
Isoelectric point according different methods:
Peptides (in silico digests for buttom-up proteomics)
Below you can find in silico digests of the whole proteome with Trypsin, Chymotrypsin, Trypsin+LysC, LysN, ArgC proteases suitable for different mass spec machines.| Try ESI |
 |
|---|
| ChTry ESI |
|
|---|
| ArgC ESI |
|
|---|
| LysN ESI |
|
|---|
| TryLysC ESI |
|
|---|
| Try MALDI |
|
|---|
| ChTry MALDI |
|
|---|
| ArgC MALDI |
|
|---|
| LysN MALDI |
|
|---|
| TryLysC MALDI |
|
|---|
| Try LTQ |
|
|---|
| ChTry LTQ |
|
|---|
| ArgC LTQ |
|
|---|
| LysN LTQ |
|
|---|
| TryLysC LTQ |
|
|---|
| Try MSlow |
|
|---|
| ChTry MSlow |
|
|---|
| ArgC MSlow |
|
|---|
| LysN MSlow |
|
|---|
| TryLysC MSlow |
|
|---|
| Try MShigh |
|
|---|
| ChTry MShigh |
|
|---|
| ArgC MShigh |
|
|---|
| LysN MShigh |
|
|---|
| TryLysC MShigh |
|
|---|
General Statistics
Number of major isoforms |
Number of additional isoforms |
Number of all proteins |
Number of amino acids |
Min. Seq. Length |
Max. Seq. Length |
Avg. Seq. Length |
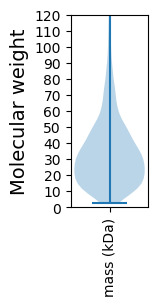
Avg. Mol. Weight |
|---|---|---|---|---|---|---|---|
0 |
1049918 |
21 |
3091 |
323.6 |
35.53 |
Amino acid frequency
Ala |
Cys |
Asp |
Glu |
Phe |
Gly |
His |
Ile |
Lys |
Leu |
|---|---|---|---|---|---|---|---|---|---|
10.12 ± 0.045 | 0.993 ± 0.015 |
5.012 ± 0.029 | 5.931 ± 0.038 |
4.053 ± 0.027 | 7.681 ± 0.047 |
2.13 ± 0.026 | 5.159 ± 0.032 |
4.819 ± 0.042 | 10.614 ± 0.051 |
Met |
Asn |
Gln |
Pro |
Arg |
Ser |
Thr |
Val |
Trp |
Tyr |
|---|---|---|---|---|---|---|---|---|---|
2.621 ± 0.021 | 3.937 ± 0.036 |
4.62 ± 0.031 | 4.438 ± 0.033 |
5.215 ± 0.038 | 6.096 ± 0.035 |
5.307 ± 0.039 | 7.509 ± 0.036 |
1.312 ± 0.018 | 2.432 ± 0.026 |
Most of the basic statistics you can see at this page can be downloaded from this CSV file
See this proteome in:

Proteome-pI is available under Creative Commons Attribution-NoDerivs license, for more details see here
| Reference: Kozlowski LP. Proteome-pI 2.0: Proteome Isoelectric Point Database Update. Nucleic Acids Res. 2021, doi: 10.1093/nar/gkab944 | Contact: Lukasz P. Kozlowski |