Sulfitobacter sp. HI0023
Taxonomy: cellular organisms; Bacteria; Proteobacteria; Alphaproteobacteria; Rhodobacterales; Roseobacteraceae; Sulfitobacter; unclassified Sulfitobacter
Average proteome isoelectric point is 6.09
Get precalculated fractions of proteins
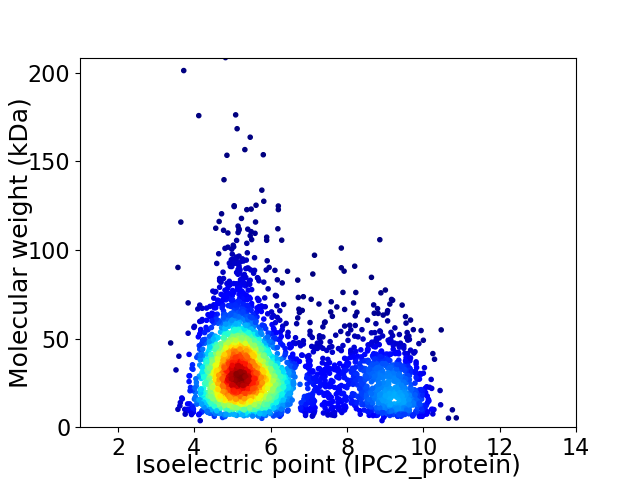
Virtual 2D-PAGE plot for 3900 proteins (isoelectric point calculated using IPC2_protein)
Get csv file with sequences according to given criteria:
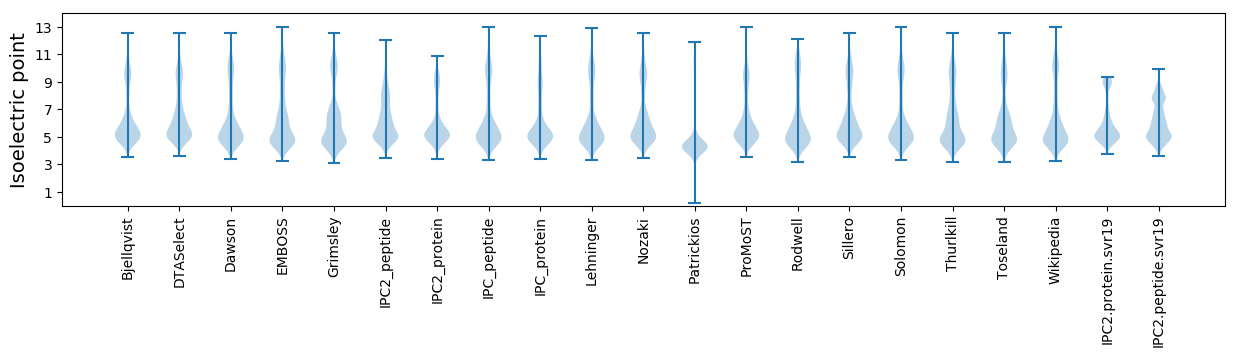
* You can choose from 21 different methods for calculating isoelectric point
Summary statistics related to proteome-wise predictions
Protein with the lowest isoelectric point:
>tr|A0A166QYQ0|A0A166QYQ0_9RHOB Diaminopimelate decarboxylase OS=Sulfitobacter sp. HI0023 OX=1822225 GN=lysA PE=3 SV=1
MM1 pKa = 7.6VYY3 pKa = 10.65VSVQIDD9 pKa = 3.32THH11 pKa = 7.11GEE13 pKa = 3.45SDD15 pKa = 3.0AAAFEE20 pKa = 4.23KK21 pKa = 10.81AIIDD25 pKa = 3.55LDD27 pKa = 4.42EE28 pKa = 4.51IVTCHH33 pKa = 5.41SVGGGSDD40 pKa = 4.63FILLVACRR48 pKa = 11.84DD49 pKa = 3.09LDD51 pKa = 3.89AYY53 pKa = 11.05VSVVRR58 pKa = 11.84DD59 pKa = 4.13FGTDD63 pKa = 3.02CGLSS67 pKa = 3.33
MM1 pKa = 7.6VYY3 pKa = 10.65VSVQIDD9 pKa = 3.32THH11 pKa = 7.11GEE13 pKa = 3.45SDD15 pKa = 3.0AAAFEE20 pKa = 4.23KK21 pKa = 10.81AIIDD25 pKa = 3.55LDD27 pKa = 4.42EE28 pKa = 4.51IVTCHH33 pKa = 5.41SVGGGSDD40 pKa = 4.63FILLVACRR48 pKa = 11.84DD49 pKa = 3.09LDD51 pKa = 3.89AYY53 pKa = 11.05VSVVRR58 pKa = 11.84DD59 pKa = 4.13FGTDD63 pKa = 3.02CGLSS67 pKa = 3.33
Molecular weight: 7.11 kDa
Isoelectric point according different methods:
Protein with the highest isoelectric point:
>tr|A0A166TZ75|A0A166TZ75_9RHOB sn-glycerol-3-phosphate import ATP-binding protein UgpC OS=Sulfitobacter sp. HI0023 OX=1822225 GN=ugpC PE=3 SV=1
MM1 pKa = 7.25ATADD5 pKa = 3.91HH6 pKa = 7.33PIAPLRR12 pKa = 11.84HH13 pKa = 5.32RR14 pKa = 11.84TLKK17 pKa = 9.83QRR19 pKa = 11.84LRR21 pKa = 11.84RR22 pKa = 11.84FLAWVRR28 pKa = 11.84KK29 pKa = 7.13TVPEE33 pKa = 4.17WLRR36 pKa = 11.84LPLGILLMLLGLLGFLPILGFWMIPVGFAVAAMGMRR72 pKa = 11.84PIRR75 pKa = 11.84ARR77 pKa = 11.84WNKK80 pKa = 9.05RR81 pKa = 11.84RR82 pKa = 11.84RR83 pKa = 11.84GG84 pKa = 3.51
MM1 pKa = 7.25ATADD5 pKa = 3.91HH6 pKa = 7.33PIAPLRR12 pKa = 11.84HH13 pKa = 5.32RR14 pKa = 11.84TLKK17 pKa = 9.83QRR19 pKa = 11.84LRR21 pKa = 11.84RR22 pKa = 11.84FLAWVRR28 pKa = 11.84KK29 pKa = 7.13TVPEE33 pKa = 4.17WLRR36 pKa = 11.84LPLGILLMLLGLLGFLPILGFWMIPVGFAVAAMGMRR72 pKa = 11.84PIRR75 pKa = 11.84ARR77 pKa = 11.84WNKK80 pKa = 9.05RR81 pKa = 11.84RR82 pKa = 11.84RR83 pKa = 11.84GG84 pKa = 3.51
Molecular weight: 9.79 kDa
Isoelectric point according different methods:
Peptides (in silico digests for buttom-up proteomics)
Below you can find in silico digests of the whole proteome with Trypsin, Chymotrypsin, Trypsin+LysC, LysN, ArgC proteases suitable for different mass spec machines.| Try ESI |
 |
|---|
| ChTry ESI |
|
|---|
| ArgC ESI |
|
|---|
| LysN ESI |
|
|---|
| TryLysC ESI |
|
|---|
| Try MALDI |
|
|---|
| ChTry MALDI |
|
|---|
| ArgC MALDI |
|
|---|
| LysN MALDI |
|
|---|
| TryLysC MALDI |
|
|---|
| Try LTQ |
|
|---|
| ChTry LTQ |
|
|---|
| ArgC LTQ |
|
|---|
| LysN LTQ |
|
|---|
| TryLysC LTQ |
|
|---|
| Try MSlow |
|
|---|
| ChTry MSlow |
|
|---|
| ArgC MSlow |
|
|---|
| LysN MSlow |
|
|---|
| TryLysC MSlow |
|
|---|
| Try MShigh |
|
|---|
| ChTry MShigh |
|
|---|
| ArgC MShigh |
|
|---|
| LysN MShigh |
|
|---|
| TryLysC MShigh |
|
|---|
General Statistics
Number of major isoforms |
Number of additional isoforms |
Number of all proteins |
Number of amino acids |
Min. Seq. Length |
Max. Seq. Length |
Avg. Seq. Length |
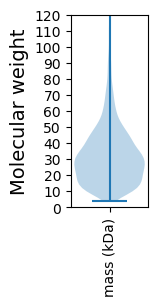
Avg. Mol. Weight |
|---|---|---|---|---|---|---|---|
0 |
1190183 |
33 |
1938 |
305.2 |
33.19 |
Amino acid frequency
Ala |
Cys |
Asp |
Glu |
Phe |
Gly |
His |
Ile |
Lys |
Leu |
|---|---|---|---|---|---|---|---|---|---|
12.235 ± 0.058 | 0.876 ± 0.011 |
6.147 ± 0.034 | 6.211 ± 0.038 |
3.669 ± 0.025 | 8.735 ± 0.039 |
2.054 ± 0.018 | 5.083 ± 0.031 |
3.133 ± 0.03 | 9.945 ± 0.042 |
Met |
Asn |
Gln |
Pro |
Arg |
Ser |
Thr |
Val |
Trp |
Tyr |
|---|---|---|---|---|---|---|---|---|---|
2.821 ± 0.019 | 2.55 ± 0.021 |
5.087 ± 0.027 | 3.157 ± 0.022 |
7.022 ± 0.039 | 5.052 ± 0.024 |
5.407 ± 0.022 | 7.2 ± 0.031 |
1.362 ± 0.016 | 2.254 ± 0.018 |
Most of the basic statistics you can see at this page can be downloaded from this CSV file
See this proteome in:

Proteome-pI is available under Creative Commons Attribution-NoDerivs license, for more details see here
| Reference: Kozlowski LP. Proteome-pI 2.0: Proteome Isoelectric Point Database Update. Nucleic Acids Res. 2021, doi: 10.1093/nar/gkab944 | Contact: Lukasz P. Kozlowski |