Rhizobium phage RR1-B
Taxonomy: Viruses; Duplodnaviria; Heunggongvirae; Uroviricota; Caudoviricetes; Caudovirales; Myoviridae; unclassified Myoviridae
Average proteome isoelectric point is 6.25
Get precalculated fractions of proteins

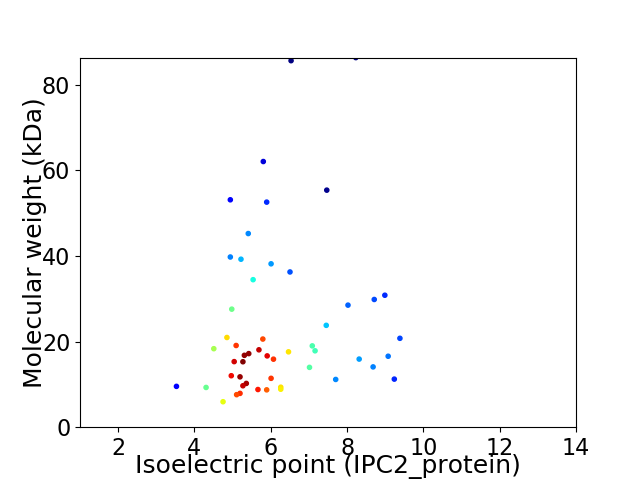
Virtual 2D-PAGE plot for 52 proteins (isoelectric point calculated using IPC2_protein)
Get csv file with sequences according to given criteria:
* You can choose from 21 different methods for calculating isoelectric point
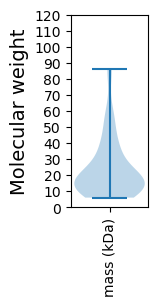
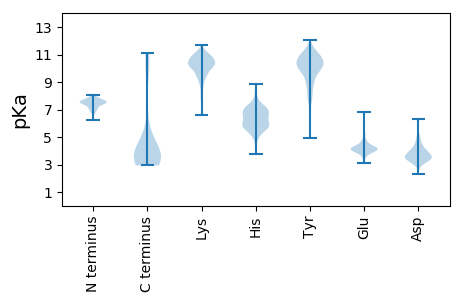
Summary statistics related to proteome-wise predictions


Protein with the lowest isoelectric point:
>tr|R9U430|R9U430_9CAUD AAA domain-containing protein OS=Rhizobium phage RR1-B OX=929834 GN=RHYG_00008 PE=4 SV=1
MM1 pKa = 7.47KK2 pKa = 10.16ALLSSYY8 pKa = 10.09PIVADD13 pKa = 3.57IDD15 pKa = 3.65DD16 pKa = 4.19AEE18 pKa = 4.14IRR20 pKa = 11.84NAIEE24 pKa = 4.23GFASEE29 pKa = 5.34LEE31 pKa = 4.04MAEE34 pKa = 4.21RR35 pKa = 11.84AEE37 pKa = 4.14SAANIWYY44 pKa = 9.68EE45 pKa = 3.82EE46 pKa = 4.14TFYY49 pKa = 11.01EE50 pKa = 4.81FPVDD54 pKa = 2.88IHH56 pKa = 6.29FRR58 pKa = 11.84AGQIAAFVSGAISMARR74 pKa = 11.84DD75 pKa = 3.5LGHH78 pKa = 7.21LPEE81 pKa = 5.11GCAAA85 pKa = 4.37
MM1 pKa = 7.47KK2 pKa = 10.16ALLSSYY8 pKa = 10.09PIVADD13 pKa = 3.57IDD15 pKa = 3.65DD16 pKa = 4.19AEE18 pKa = 4.14IRR20 pKa = 11.84NAIEE24 pKa = 4.23GFASEE29 pKa = 5.34LEE31 pKa = 4.04MAEE34 pKa = 4.21RR35 pKa = 11.84AEE37 pKa = 4.14SAANIWYY44 pKa = 9.68EE45 pKa = 3.82EE46 pKa = 4.14TFYY49 pKa = 11.01EE50 pKa = 4.81FPVDD54 pKa = 2.88IHH56 pKa = 6.29FRR58 pKa = 11.84AGQIAAFVSGAISMARR74 pKa = 11.84DD75 pKa = 3.5LGHH78 pKa = 7.21LPEE81 pKa = 5.11GCAAA85 pKa = 4.37
Molecular weight: 9.28 kDa
Isoelectric point according different methods:
Protein with the highest isoelectric point:
>tr|R9U0S7|R9U0S7_9CAUD Uncharacterized protein OS=Rhizobium phage RR1-B OX=929834 GN=RHYG_00014 PE=4 SV=1
MM1 pKa = 6.97QRR3 pKa = 11.84DD4 pKa = 3.8GSTLHH9 pKa = 6.84FDD11 pKa = 4.85RR12 pKa = 11.84IFEE15 pKa = 4.46ALDD18 pKa = 3.19GTACLTLDD26 pKa = 3.49TLEE29 pKa = 4.56EE30 pKa = 4.24KK31 pKa = 10.79SGLTRR36 pKa = 11.84TQLARR41 pKa = 11.84VTAKK45 pKa = 9.66MVTAALIEE53 pKa = 4.0RR54 pKa = 11.84RR55 pKa = 11.84KK56 pKa = 9.08MGCYY60 pKa = 9.58QLTAVGQKK68 pKa = 10.23AKK70 pKa = 9.55RR71 pKa = 11.84TGNIPMPVQPIRR83 pKa = 11.84PAAPPSDD90 pKa = 3.93SFRR93 pKa = 11.84QRR95 pKa = 11.84LWSIMRR101 pKa = 11.84MSGTFMAAEE110 pKa = 4.2LVMAANWPLKK120 pKa = 10.26RR121 pKa = 11.84PEE123 pKa = 4.05FEE125 pKa = 3.94AGKK128 pKa = 10.61YY129 pKa = 10.17LLALKK134 pKa = 10.28RR135 pKa = 11.84AGYY138 pKa = 10.05LIEE141 pKa = 4.68LPKK144 pKa = 10.73GPRR147 pKa = 11.84GQMRR151 pKa = 11.84YY152 pKa = 9.87RR153 pKa = 11.84LVRR156 pKa = 11.84NSGLLAPVVSSVDD169 pKa = 3.26GSVYY173 pKa = 10.8DD174 pKa = 3.9PNTRR178 pKa = 11.84EE179 pKa = 4.25AMPCAKK185 pKa = 9.93QAA187 pKa = 3.29
MM1 pKa = 6.97QRR3 pKa = 11.84DD4 pKa = 3.8GSTLHH9 pKa = 6.84FDD11 pKa = 4.85RR12 pKa = 11.84IFEE15 pKa = 4.46ALDD18 pKa = 3.19GTACLTLDD26 pKa = 3.49TLEE29 pKa = 4.56EE30 pKa = 4.24KK31 pKa = 10.79SGLTRR36 pKa = 11.84TQLARR41 pKa = 11.84VTAKK45 pKa = 9.66MVTAALIEE53 pKa = 4.0RR54 pKa = 11.84RR55 pKa = 11.84KK56 pKa = 9.08MGCYY60 pKa = 9.58QLTAVGQKK68 pKa = 10.23AKK70 pKa = 9.55RR71 pKa = 11.84TGNIPMPVQPIRR83 pKa = 11.84PAAPPSDD90 pKa = 3.93SFRR93 pKa = 11.84QRR95 pKa = 11.84LWSIMRR101 pKa = 11.84MSGTFMAAEE110 pKa = 4.2LVMAANWPLKK120 pKa = 10.26RR121 pKa = 11.84PEE123 pKa = 4.05FEE125 pKa = 3.94AGKK128 pKa = 10.61YY129 pKa = 10.17LLALKK134 pKa = 10.28RR135 pKa = 11.84AGYY138 pKa = 10.05LIEE141 pKa = 4.68LPKK144 pKa = 10.73GPRR147 pKa = 11.84GQMRR151 pKa = 11.84YY152 pKa = 9.87RR153 pKa = 11.84LVRR156 pKa = 11.84NSGLLAPVVSSVDD169 pKa = 3.26GSVYY173 pKa = 10.8DD174 pKa = 3.9PNTRR178 pKa = 11.84EE179 pKa = 4.25AMPCAKK185 pKa = 9.93QAA187 pKa = 3.29
Molecular weight: 20.76 kDa
Isoelectric point according different methods:
Peptides (in silico digests for buttom-up proteomics)
Below you can find in silico digests of the whole proteome with Trypsin, Chymotrypsin, Trypsin+LysC, LysN, ArgC proteases suitable for different mass spec machines.| Try ESI |
 |
|---|
| ChTry ESI |
 |
|---|
| ArgC ESI |
 |
|---|
| LysN ESI |
 |
|---|
| TryLysC ESI |
 |
|---|
| Try MALDI |
 |
|---|
| ChTry MALDI |
 |
|---|
| ArgC MALDI |
 |
|---|
| LysN MALDI |
 |
|---|
| TryLysC MALDI |
 |
|---|
| Try LTQ |
 |
|---|
| ChTry LTQ |
 |
|---|
| ArgC LTQ |
 |
|---|
| LysN LTQ |
 |
|---|
| TryLysC LTQ |
 |
|---|
| Try MSlow |
 |
|---|
| ChTry MSlow |
 |
|---|
| ArgC MSlow |
 |
|---|
| LysN MSlow |
 |
|---|
| TryLysC MSlow |
 |
|---|
| Try MShigh |
 |
|---|
| ChTry MShigh |
 |
|---|
| ArgC MShigh |
 |
|---|
| LysN MShigh |
 |
|---|
| TryLysC MShigh |
 |
|---|
General Statistics
Number of major isoforms |
Number of additional isoforms |
Number of all proteins |
Number of amino acids |
Min. Seq. Length |
Max. Seq. Length |
Avg. Seq. Length |
Avg. Mol. Weight |
|---|---|---|---|---|---|---|---|
0 |
11458 |
53 |
826 |
220.3 |
24.07 |
Amino acid frequency
Ala |
Cys |
Asp |
Glu |
Phe |
Gly |
His |
Ile |
Lys |
Leu |
|---|---|---|---|---|---|---|---|---|---|
12.568 ± 0.645 | 0.628 ± 0.105 |
5.786 ± 0.254 | 6.572 ± 0.363 |
3.657 ± 0.184 | 7.322 ± 0.494 |
1.702 ± 0.133 | 5.577 ± 0.178 |
5.132 ± 0.259 | 8.562 ± 0.267 |
Met |
Asn |
Gln |
Pro |
Arg |
Ser |
Thr |
Val |
Trp |
Tyr |
|---|---|---|---|---|---|---|---|---|---|
2.583 ± 0.174 | 3.212 ± 0.203 |
4.73 ± 0.289 | 3.055 ± 0.159 |
6.336 ± 0.358 | 6.162 ± 0.284 |
5.813 ± 0.288 | 6.825 ± 0.275 |
1.501 ± 0.137 | 2.278 ± 0.163 |
Most of the basic statistics you can see at this page can be downloaded from this CSV file
Proteome-pI is available under Creative Commons Attribution-NoDerivs license, for more details see here
| Reference: Kozlowski LP. Proteome-pI 2.0: Proteome Isoelectric Point Database Update. Nucleic Acids Res. 2021, doi: 10.1093/nar/gkab944 | Contact: Lukasz P. Kozlowski |
