Chlamydomonas eustigma
Taxonomy: cellular organisms; Eukaryota; Viridiplantae; Chlorophyta; core chlorophytes; Chlorophyceae; CS clade; Chlamydomonadales; Chlamydomonadaceae; Chlamydomonas
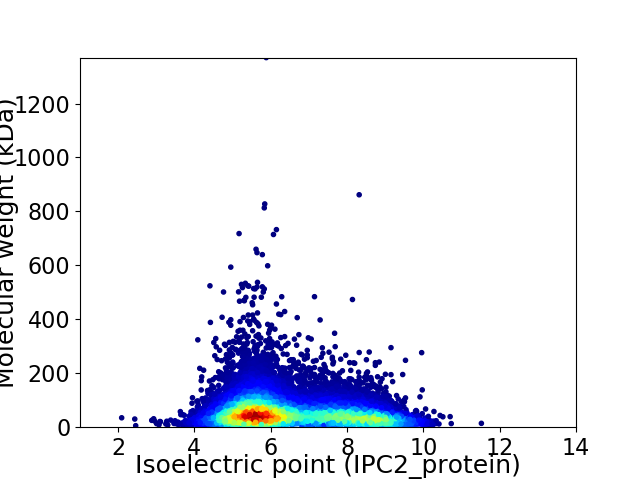
Average proteome isoelectric point is 6.53
Get precalculated fractions of proteins

Virtual 2D-PAGE plot for 14139 proteins (isoelectric point calculated using IPC2_protein)
Get csv file with sequences according to given criteria:
* You can choose from 21 different methods for calculating isoelectric point
Summary statistics related to proteome-wise predictions


Protein with the lowest isoelectric point:
>tr|A0A250XQE6|A0A250XQE6_9CHLO Isoform of A0A250XQE7 Uncharacterized protein (Fragment) OS=Chlamydomonas eustigma OX=1157962 GN=CEUSTIGMA_g12702.t1 PE=4 SV=1
MM1 pKa = 6.85VQQHH5 pKa = 6.37DD6 pKa = 3.79VGMDD10 pKa = 3.51HH11 pKa = 6.99QPVEE15 pKa = 4.37QQQHH19 pKa = 6.52DD20 pKa = 3.95GGMDD24 pKa = 3.51HH25 pKa = 6.93QPVEE29 pKa = 4.37QQQHH33 pKa = 6.52DD34 pKa = 3.73GGMDD38 pKa = 3.44HH39 pKa = 7.17QSVEE43 pKa = 4.28QQQHH47 pKa = 6.47DD48 pKa = 3.9GGMDD52 pKa = 3.51HH53 pKa = 6.93QPVEE57 pKa = 4.22QQQQEE62 pKa = 4.3GGMDD66 pKa = 3.7HH67 pKa = 6.8QPVEE71 pKa = 4.37QQQHH75 pKa = 6.37DD76 pKa = 4.44GGTEE80 pKa = 3.74TCGPVDD86 pKa = 4.67QPWLQQPTLADD97 pKa = 3.65EE98 pKa = 4.71VGSEE102 pKa = 5.18AEE104 pKa = 3.96IEE106 pKa = 4.32NNGAHH111 pKa = 7.26PDD113 pKa = 3.56GSSAEE118 pKa = 4.23VVGNMVSPSEE128 pKa = 4.06DD129 pKa = 2.83AVIEE133 pKa = 4.21VEE135 pKa = 4.31YY136 pKa = 11.23VPAEE140 pKa = 4.18DD141 pKa = 3.44MHH143 pKa = 8.56AEE145 pKa = 3.97SDD147 pKa = 3.65QAGDD151 pKa = 3.52STEE154 pKa = 4.19GVV156 pKa = 3.42
MM1 pKa = 6.85VQQHH5 pKa = 6.37DD6 pKa = 3.79VGMDD10 pKa = 3.51HH11 pKa = 6.99QPVEE15 pKa = 4.37QQQHH19 pKa = 6.52DD20 pKa = 3.95GGMDD24 pKa = 3.51HH25 pKa = 6.93QPVEE29 pKa = 4.37QQQHH33 pKa = 6.52DD34 pKa = 3.73GGMDD38 pKa = 3.44HH39 pKa = 7.17QSVEE43 pKa = 4.28QQQHH47 pKa = 6.47DD48 pKa = 3.9GGMDD52 pKa = 3.51HH53 pKa = 6.93QPVEE57 pKa = 4.22QQQQEE62 pKa = 4.3GGMDD66 pKa = 3.7HH67 pKa = 6.8QPVEE71 pKa = 4.37QQQHH75 pKa = 6.37DD76 pKa = 4.44GGTEE80 pKa = 3.74TCGPVDD86 pKa = 4.67QPWLQQPTLADD97 pKa = 3.65EE98 pKa = 4.71VGSEE102 pKa = 5.18AEE104 pKa = 3.96IEE106 pKa = 4.32NNGAHH111 pKa = 7.26PDD113 pKa = 3.56GSSAEE118 pKa = 4.23VVGNMVSPSEE128 pKa = 4.06DD129 pKa = 2.83AVIEE133 pKa = 4.21VEE135 pKa = 4.31YY136 pKa = 11.23VPAEE140 pKa = 4.18DD141 pKa = 3.44MHH143 pKa = 8.56AEE145 pKa = 3.97SDD147 pKa = 3.65QAGDD151 pKa = 3.52STEE154 pKa = 4.19GVV156 pKa = 3.42
Molecular weight: 16.95 kDa
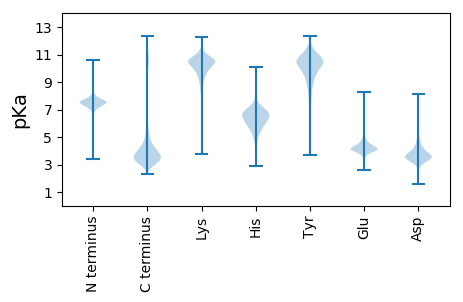
Isoelectric point according different methods:
Protein with the highest isoelectric point:
>tr|A0A250XC52|A0A250XC52_9CHLO Isoform of A0A250XCJ4 Uncharacterized protein (Fragment) OS=Chlamydomonas eustigma OX=1157962 GN=CEUSTIGMA_g7918.t1 PE=4 SV=1
MM1 pKa = 7.58RR2 pKa = 11.84LVAMRR7 pKa = 11.84LIVMRR12 pKa = 11.84LIVMTMIVMRR22 pKa = 11.84LVVMRR27 pKa = 11.84LVAMRR32 pKa = 11.84LIVMRR37 pKa = 11.84LIVMRR42 pKa = 11.84LVVMRR47 pKa = 11.84LIAMRR52 pKa = 11.84LIVMTMIVMRR62 pKa = 11.84LVVMRR67 pKa = 11.84LIVMRR72 pKa = 11.84LVAMRR77 pKa = 11.84LIAMRR82 pKa = 11.84LIVMRR87 pKa = 11.84LVVMRR92 pKa = 11.84LVAMRR97 pKa = 11.84LIVMRR102 pKa = 11.84LIVMRR107 pKa = 11.84LVVMRR112 pKa = 11.84LIVMTMIVV120 pKa = 3.14
MM1 pKa = 7.58RR2 pKa = 11.84LVAMRR7 pKa = 11.84LIVMRR12 pKa = 11.84LIVMTMIVMRR22 pKa = 11.84LVVMRR27 pKa = 11.84LVAMRR32 pKa = 11.84LIVMRR37 pKa = 11.84LIVMRR42 pKa = 11.84LVVMRR47 pKa = 11.84LIAMRR52 pKa = 11.84LIVMTMIVMRR62 pKa = 11.84LVVMRR67 pKa = 11.84LIVMRR72 pKa = 11.84LVAMRR77 pKa = 11.84LIAMRR82 pKa = 11.84LIVMRR87 pKa = 11.84LVVMRR92 pKa = 11.84LVAMRR97 pKa = 11.84LIVMRR102 pKa = 11.84LIVMRR107 pKa = 11.84LVVMRR112 pKa = 11.84LIVMTMIVV120 pKa = 3.14
Molecular weight: 14.32 kDa
Isoelectric point according different methods:
Peptides (in silico digests for buttom-up proteomics)
Below you can find in silico digests of the whole proteome with Trypsin, Chymotrypsin, Trypsin+LysC, LysN, ArgC proteases suitable for different mass spec machines.| Try ESI |
 |
|---|
| ChTry ESI |
 |
|---|
| ArgC ESI |
 |
|---|
| LysN ESI |
 |
|---|
| TryLysC ESI |
 |
|---|
| Try MALDI |
 |
|---|
| ChTry MALDI |
 |
|---|
| ArgC MALDI |
 |
|---|
| LysN MALDI |
 |
|---|
| TryLysC MALDI |
 |
|---|
| Try LTQ |
 |
|---|
| ChTry LTQ |
 |
|---|
| ArgC LTQ |
 |
|---|
| LysN LTQ |
 |
|---|
| TryLysC LTQ |
 |
|---|
| Try MSlow |
 |
|---|
| ChTry MSlow |
 |
|---|
| ArgC MSlow |
 |
|---|
| LysN MSlow |
 |
|---|
| TryLysC MSlow |
 |
|---|
| Try MShigh |
 |
|---|
| ChTry MShigh |
 |
|---|
| ArgC MShigh |
 |
|---|
| LysN MShigh |
 |
|---|
| TryLysC MShigh |
 |
|---|
General Statistics
Number of major isoforms |
Number of additional isoforms |
Number of all proteins |
Number of amino acids |
Min. Seq. Length |
Max. Seq. Length |
Avg. Seq. Length |
Avg. Mol. Weight |
|---|---|---|---|---|---|---|---|
8159502 |
22 |
13200 |
577.1 |
62.81 |
Amino acid frequency
Ala |
Cys |
Asp |
Glu |
Phe |
Gly |
His |
Ile |
Lys |
Leu |
|---|---|---|---|---|---|---|---|---|---|
9.535 ± 0.026 | 1.64 ± 0.009 |
4.948 ± 0.014 | 5.873 ± 0.023 |
2.892 ± 0.013 | 7.075 ± 0.022 |
2.684 ± 0.012 | 3.925 ± 0.013 |
4.532 ± 0.019 | 9.758 ± 0.022 |
Met |
Asn |
Gln |
Pro |
Arg |
Ser |
Thr |
Val |
Trp |
Tyr |
|---|---|---|---|---|---|---|---|---|---|
2.64 ± 0.009 | 3.325 ± 0.011 |
5.787 ± 0.03 | 4.832 ± 0.017 |
5.356 ± 0.015 | 9.725 ± 0.03 |
5.444 ± 0.014 | 6.63 ± 0.013 |
1.148 ± 0.006 | 2.249 ± 0.01 |
Most of the basic statistics you can see at this page can be downloaded from this CSV file
Proteome-pI is available under Creative Commons Attribution-NoDerivs license, for more details see here
| Reference: Kozlowski LP. Proteome-pI 2.0: Proteome Isoelectric Point Database Update. Nucleic Acids Res. 2021, doi: 10.1093/nar/gkab944 | Contact: Lukasz P. Kozlowski |
