Natrarchaeobius chitinivorans
Taxonomy: cellular organisms; Archaea; Euryarchaeota; Stenosarchaea group; Halobacteria; Natrialbales; Natrialbaceae; Natrarchaeobius
Average proteome isoelectric point is 4.91
Get precalculated fractions of proteins
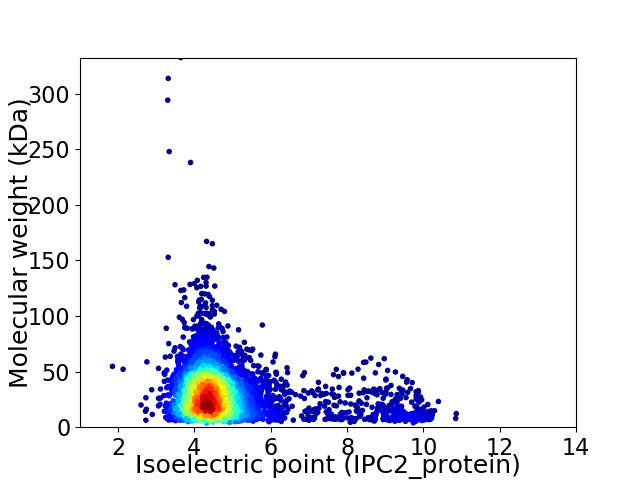
Virtual 2D-PAGE plot for 4237 proteins (isoelectric point calculated using IPC2_protein)
Get csv file with sequences according to given criteria:
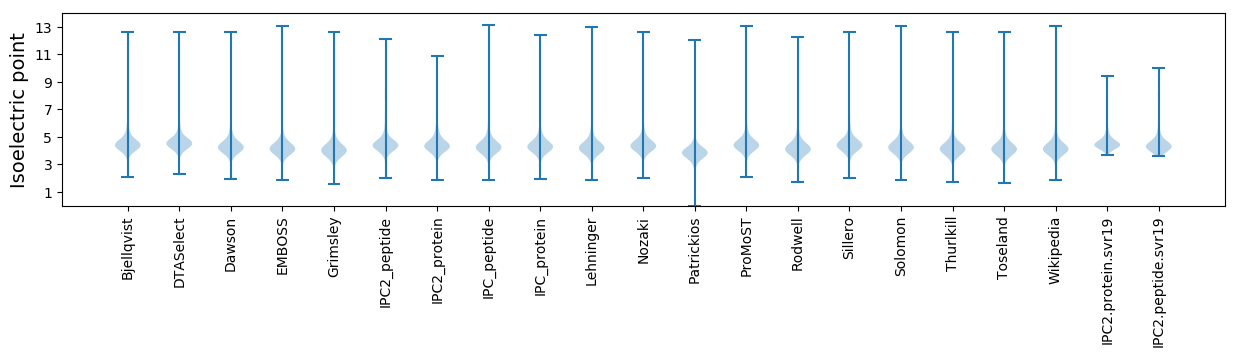
* You can choose from 21 different methods for calculating isoelectric point
Summary statistics related to proteome-wise predictions
Protein with the lowest isoelectric point:
>tr|A0A3N6LTQ8|A0A3N6LTQ8_9EURY Uncharacterized protein OS=Natrarchaeobius chitinivorans OX=1679083 GN=EA473_19830 PE=4 SV=1
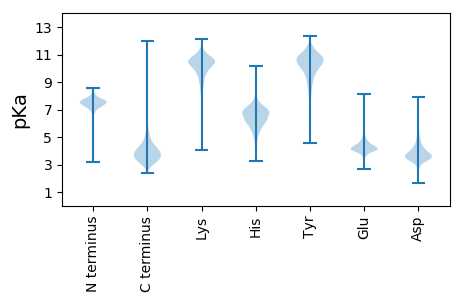
MM1 pKa = 7.4KK2 pKa = 10.49RR3 pKa = 11.84LLLVVLVAAMLALAGCADD21 pKa = 3.85GTGTGTDD28 pKa = 4.43DD29 pKa = 3.68PTVDD33 pKa = 4.31ADD35 pKa = 5.05DD36 pKa = 5.25DD37 pKa = 4.67LEE39 pKa = 4.37EE40 pKa = 4.49TDD42 pKa = 5.63PDD44 pKa = 3.76ATDD47 pKa = 4.89DD48 pKa = 4.93DD49 pKa = 5.18SEE51 pKa = 4.3TDD53 pKa = 3.38EE54 pKa = 5.19AKK56 pKa = 10.39PDD58 pKa = 3.67SDD60 pKa = 4.04EE61 pKa = 5.58SDD63 pKa = 3.59DD64 pKa = 5.8AEE66 pKa = 4.73TNDD69 pKa = 4.51SDD71 pKa = 5.77SGDD74 pKa = 3.88DD75 pKa = 3.76PNIDD79 pKa = 3.51GEE81 pKa = 4.61LEE83 pKa = 3.71IHH85 pKa = 6.92HH86 pKa = 7.0IDD88 pKa = 4.14VGQADD93 pKa = 4.2ATLLIEE99 pKa = 4.42PSGEE103 pKa = 4.02TMLIDD108 pKa = 4.48SGDD111 pKa = 3.24WRR113 pKa = 11.84QGGSEE118 pKa = 4.16VIAYY122 pKa = 10.44LEE124 pKa = 4.22DD125 pKa = 3.63QNVNRR130 pKa = 11.84IDD132 pKa = 3.83HH133 pKa = 6.55LVATHH138 pKa = 5.68GHH140 pKa = 6.58ADD142 pKa = 3.61HH143 pKa = 7.2IGGHH147 pKa = 5.85DD148 pKa = 4.36AIIEE152 pKa = 4.24HH153 pKa = 6.69YY154 pKa = 7.84EE155 pKa = 3.93TEE157 pKa = 4.24RR158 pKa = 11.84NGIGAAYY165 pKa = 10.03DD166 pKa = 3.25SGVAHH171 pKa = 7.04TSQTYY176 pKa = 9.15EE177 pKa = 4.16RR178 pKa = 11.84YY179 pKa = 10.07LDD181 pKa = 5.47AIDD184 pKa = 3.6EE185 pKa = 4.75HH186 pKa = 8.06NVEE189 pKa = 4.21LLIVEE194 pKa = 4.51EE195 pKa = 4.54GDD197 pKa = 3.59HH198 pKa = 7.91IEE200 pKa = 4.81FGDD203 pKa = 4.2ANVDD207 pKa = 3.62VLNPPTGDD215 pKa = 3.34SGSDD219 pKa = 2.82LHH221 pKa = 6.87YY222 pKa = 11.25NSVTLAIEE230 pKa = 4.25FGEE233 pKa = 4.15FSYY236 pKa = 9.84LTTGDD241 pKa = 3.51VEE243 pKa = 5.0ADD245 pKa = 2.97AEE247 pKa = 4.03QRR249 pKa = 11.84MVDD252 pKa = 3.4EE253 pKa = 5.63HH254 pKa = 7.45DD255 pKa = 4.86DD256 pKa = 3.77SLEE259 pKa = 4.2ADD261 pKa = 4.32AYY263 pKa = 10.05QAGHH267 pKa = 6.74HH268 pKa = 6.31GSSTSSTTPFMNEE281 pKa = 3.45VTPAIAIISSAYY293 pKa = 9.72DD294 pKa = 3.16SQYY297 pKa = 11.13GHH299 pKa = 6.95PHH301 pKa = 6.9DD302 pKa = 5.27EE303 pKa = 4.19VLEE306 pKa = 4.76DD307 pKa = 3.61YY308 pKa = 10.99ADD310 pKa = 4.12RR311 pKa = 11.84GIEE314 pKa = 4.25TYY316 pKa = 7.55WTAVHH321 pKa = 6.6GDD323 pKa = 3.59VVLTTDD329 pKa = 3.27GTDD332 pKa = 3.07VEE334 pKa = 5.53LEE336 pKa = 4.34TEE338 pKa = 4.47HH339 pKa = 6.78EE340 pKa = 4.6FSTEE344 pKa = 3.69AADD347 pKa = 4.83LLEE350 pKa = 5.01EE351 pKa = 4.98KK352 pKa = 10.29PADD355 pKa = 4.52DD356 pKa = 4.27DD357 pKa = 4.0TQASVTHH364 pKa = 7.05LIDD367 pKa = 3.66VAPAPLDD374 pKa = 3.49GG375 pKa = 4.96
MM1 pKa = 7.4KK2 pKa = 10.49RR3 pKa = 11.84LLLVVLVAAMLALAGCADD21 pKa = 3.85GTGTGTDD28 pKa = 4.43DD29 pKa = 3.68PTVDD33 pKa = 4.31ADD35 pKa = 5.05DD36 pKa = 5.25DD37 pKa = 4.67LEE39 pKa = 4.37EE40 pKa = 4.49TDD42 pKa = 5.63PDD44 pKa = 3.76ATDD47 pKa = 4.89DD48 pKa = 4.93DD49 pKa = 5.18SEE51 pKa = 4.3TDD53 pKa = 3.38EE54 pKa = 5.19AKK56 pKa = 10.39PDD58 pKa = 3.67SDD60 pKa = 4.04EE61 pKa = 5.58SDD63 pKa = 3.59DD64 pKa = 5.8AEE66 pKa = 4.73TNDD69 pKa = 4.51SDD71 pKa = 5.77SGDD74 pKa = 3.88DD75 pKa = 3.76PNIDD79 pKa = 3.51GEE81 pKa = 4.61LEE83 pKa = 3.71IHH85 pKa = 6.92HH86 pKa = 7.0IDD88 pKa = 4.14VGQADD93 pKa = 4.2ATLLIEE99 pKa = 4.42PSGEE103 pKa = 4.02TMLIDD108 pKa = 4.48SGDD111 pKa = 3.24WRR113 pKa = 11.84QGGSEE118 pKa = 4.16VIAYY122 pKa = 10.44LEE124 pKa = 4.22DD125 pKa = 3.63QNVNRR130 pKa = 11.84IDD132 pKa = 3.83HH133 pKa = 6.55LVATHH138 pKa = 5.68GHH140 pKa = 6.58ADD142 pKa = 3.61HH143 pKa = 7.2IGGHH147 pKa = 5.85DD148 pKa = 4.36AIIEE152 pKa = 4.24HH153 pKa = 6.69YY154 pKa = 7.84EE155 pKa = 3.93TEE157 pKa = 4.24RR158 pKa = 11.84NGIGAAYY165 pKa = 10.03DD166 pKa = 3.25SGVAHH171 pKa = 7.04TSQTYY176 pKa = 9.15EE177 pKa = 4.16RR178 pKa = 11.84YY179 pKa = 10.07LDD181 pKa = 5.47AIDD184 pKa = 3.6EE185 pKa = 4.75HH186 pKa = 8.06NVEE189 pKa = 4.21LLIVEE194 pKa = 4.51EE195 pKa = 4.54GDD197 pKa = 3.59HH198 pKa = 7.91IEE200 pKa = 4.81FGDD203 pKa = 4.2ANVDD207 pKa = 3.62VLNPPTGDD215 pKa = 3.34SGSDD219 pKa = 2.82LHH221 pKa = 6.87YY222 pKa = 11.25NSVTLAIEE230 pKa = 4.25FGEE233 pKa = 4.15FSYY236 pKa = 9.84LTTGDD241 pKa = 3.51VEE243 pKa = 5.0ADD245 pKa = 2.97AEE247 pKa = 4.03QRR249 pKa = 11.84MVDD252 pKa = 3.4EE253 pKa = 5.63HH254 pKa = 7.45DD255 pKa = 4.86DD256 pKa = 3.77SLEE259 pKa = 4.2ADD261 pKa = 4.32AYY263 pKa = 10.05QAGHH267 pKa = 6.74HH268 pKa = 6.31GSSTSSTTPFMNEE281 pKa = 3.45VTPAIAIISSAYY293 pKa = 9.72DD294 pKa = 3.16SQYY297 pKa = 11.13GHH299 pKa = 6.95PHH301 pKa = 6.9DD302 pKa = 5.27EE303 pKa = 4.19VLEE306 pKa = 4.76DD307 pKa = 3.61YY308 pKa = 10.99ADD310 pKa = 4.12RR311 pKa = 11.84GIEE314 pKa = 4.25TYY316 pKa = 7.55WTAVHH321 pKa = 6.6GDD323 pKa = 3.59VVLTTDD329 pKa = 3.27GTDD332 pKa = 3.07VEE334 pKa = 5.53LEE336 pKa = 4.34TEE338 pKa = 4.47HH339 pKa = 6.78EE340 pKa = 4.6FSTEE344 pKa = 3.69AADD347 pKa = 4.83LLEE350 pKa = 5.01EE351 pKa = 4.98KK352 pKa = 10.29PADD355 pKa = 4.52DD356 pKa = 4.27DD357 pKa = 4.0TQASVTHH364 pKa = 7.05LIDD367 pKa = 3.66VAPAPLDD374 pKa = 3.49GG375 pKa = 4.96
Molecular weight: 40.34 kDa
Isoelectric point according different methods:
Protein with the highest isoelectric point:
>tr|A0A3N6LYG0|A0A3N6LYG0_9EURY Transcription initiation factor IIB OS=Natrarchaeobius chitinivorans OX=1679083 GN=tfb PE=3 SV=1
MM1 pKa = 7.15VLKK4 pKa = 10.64KK5 pKa = 10.76LLGSRR10 pKa = 11.84ATRR13 pKa = 11.84SLTVFSVLAEE23 pKa = 4.12AKK25 pKa = 9.9RR26 pKa = 11.84AFGRR30 pKa = 11.84GRR32 pKa = 11.84RR33 pKa = 11.84TRR35 pKa = 11.84GLLLLGVAALAWKK48 pKa = 7.3WTVIGLVAQGIVGVLRR64 pKa = 11.84RR65 pKa = 11.84GRR67 pKa = 11.84SGGSSPSS74 pKa = 3.16
MM1 pKa = 7.15VLKK4 pKa = 10.64KK5 pKa = 10.76LLGSRR10 pKa = 11.84ATRR13 pKa = 11.84SLTVFSVLAEE23 pKa = 4.12AKK25 pKa = 9.9RR26 pKa = 11.84AFGRR30 pKa = 11.84GRR32 pKa = 11.84RR33 pKa = 11.84TRR35 pKa = 11.84GLLLLGVAALAWKK48 pKa = 7.3WTVIGLVAQGIVGVLRR64 pKa = 11.84RR65 pKa = 11.84GRR67 pKa = 11.84SGGSSPSS74 pKa = 3.16
Molecular weight: 7.83 kDa
Isoelectric point according different methods:
Peptides (in silico digests for buttom-up proteomics)
Below you can find in silico digests of the whole proteome with Trypsin, Chymotrypsin, Trypsin+LysC, LysN, ArgC proteases suitable for different mass spec machines.| Try ESI |
 |
|---|
| ChTry ESI |
|
|---|
| ArgC ESI |
|
|---|
| LysN ESI |
|
|---|
| TryLysC ESI |
|
|---|
| Try MALDI |
|
|---|
| ChTry MALDI |
|
|---|
| ArgC MALDI |
|
|---|
| LysN MALDI |
|
|---|
| TryLysC MALDI |
|
|---|
| Try LTQ |
|
|---|
| ChTry LTQ |
|
|---|
| ArgC LTQ |
|
|---|
| LysN LTQ |
|
|---|
| TryLysC LTQ |
|
|---|
| Try MSlow |
|
|---|
| ChTry MSlow |
|
|---|
| ArgC MSlow |
|
|---|
| LysN MSlow |
|
|---|
| TryLysC MSlow |
|
|---|
| Try MShigh |
|
|---|
| ChTry MShigh |
|
|---|
| ArgC MShigh |
|
|---|
| LysN MShigh |
|
|---|
| TryLysC MShigh |
|
|---|
General Statistics
Number of major isoforms |
Number of additional isoforms |
Number of all proteins |
Number of amino acids |
Min. Seq. Length |
Max. Seq. Length |
Avg. Seq. Length |
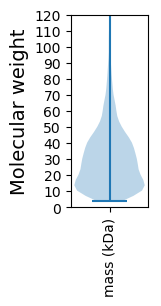
Avg. Mol. Weight |
|---|---|---|---|---|---|---|---|
0 |
1218109 |
31 |
3074 |
287.5 |
31.43 |
Amino acid frequency
Ala |
Cys |
Asp |
Glu |
Phe |
Gly |
His |
Ile |
Lys |
Leu |
|---|---|---|---|---|---|---|---|---|---|
9.848 ± 0.048 | 0.765 ± 0.013 |
8.635 ± 0.055 | 9.199 ± 0.059 |
3.316 ± 0.029 | 8.262 ± 0.043 |
2.038 ± 0.018 | 4.568 ± 0.032 |
1.749 ± 0.023 | 8.747 ± 0.046 |
Met |
Asn |
Gln |
Pro |
Arg |
Ser |
Thr |
Val |
Trp |
Tyr |
|---|---|---|---|---|---|---|---|---|---|
1.702 ± 0.015 | 2.357 ± 0.021 |
4.646 ± 0.025 | 2.372 ± 0.023 |
6.683 ± 0.044 | 5.856 ± 0.028 |
6.479 ± 0.033 | 8.907 ± 0.038 |
1.133 ± 0.014 | 2.738 ± 0.019 |
Most of the basic statistics you can see at this page can be downloaded from this CSV file
See this proteome in:

Proteome-pI is available under Creative Commons Attribution-NoDerivs license, for more details see here
| Reference: Kozlowski LP. Proteome-pI 2.0: Proteome Isoelectric Point Database Update. Nucleic Acids Res. 2021, doi: 10.1093/nar/gkab944 | Contact: Lukasz P. Kozlowski |