Bodo saltans virus
Taxonomy: Viruses; Varidnaviria; Bamfordvirae; Nucleocytoviricota; Megaviricetes; Imitervirales; Mimiviridae; unclassified Mimiviridae; Klosneuvirinae; Klosneuvirus
Average proteome isoelectric point is 6.57
Get precalculated fractions of proteins
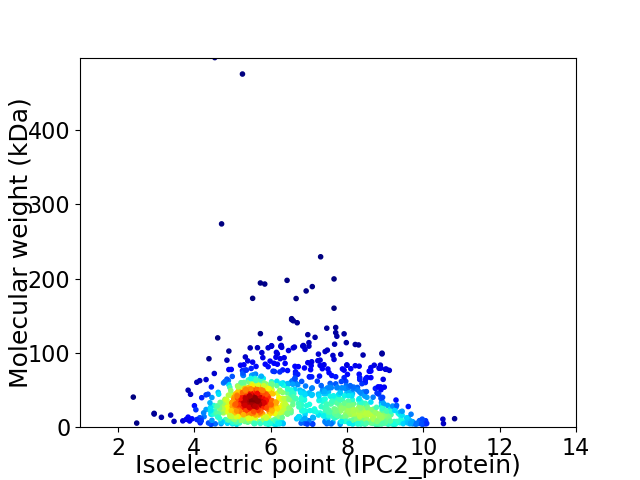
Virtual 2D-PAGE plot for 1186 proteins (isoelectric point calculated using IPC2_protein)
Get csv file with sequences according to given criteria:
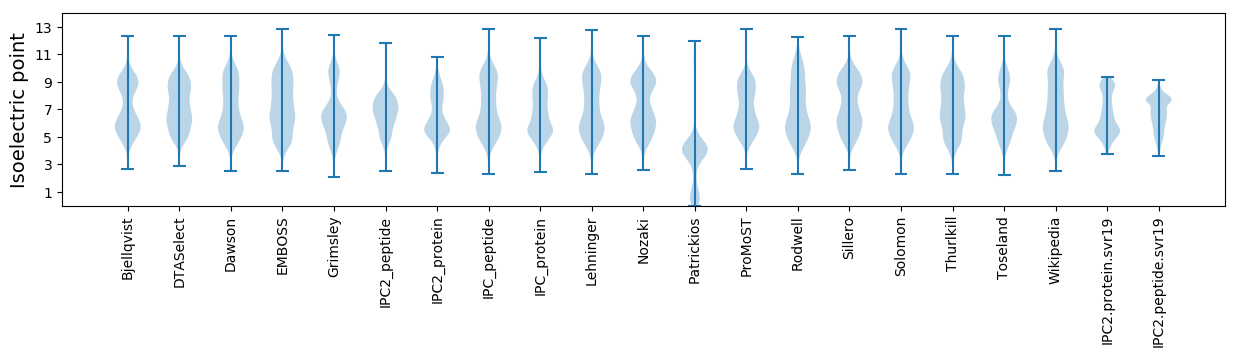
* You can choose from 21 different methods for calculating isoelectric point
Summary statistics related to proteome-wise predictions
Protein with the lowest isoelectric point:
>tr|A0A2H4UTS5|A0A2H4UTS5_9VIRU Uncharacterized protein OS=Bodo saltans virus OX=2024608 GN=BMW23_0283 PE=4 SV=1
MM1 pKa = 7.27YY2 pKa = 10.6KK3 pKa = 10.08NDD5 pKa = 5.46KK6 pKa = 10.23IDD8 pKa = 4.67LNDD11 pKa = 3.79DD12 pKa = 3.75SIYY15 pKa = 10.85DD16 pKa = 3.77YY17 pKa = 11.22VIEE20 pKa = 4.64DD21 pKa = 4.0TLTSYY26 pKa = 10.45VPKK29 pKa = 10.4RR30 pKa = 11.84KK31 pKa = 9.65EE32 pKa = 3.77NEE34 pKa = 4.36DD35 pKa = 3.36IEE37 pKa = 4.69TFIDD41 pKa = 3.86DD42 pKa = 3.88SSNFEE47 pKa = 3.7IPFFYY52 pKa = 9.93MIFVMVILALVYY64 pKa = 10.49IFFIQQ69 pKa = 3.52
MM1 pKa = 7.27YY2 pKa = 10.6KK3 pKa = 10.08NDD5 pKa = 5.46KK6 pKa = 10.23IDD8 pKa = 4.67LNDD11 pKa = 3.79DD12 pKa = 3.75SIYY15 pKa = 10.85DD16 pKa = 3.77YY17 pKa = 11.22VIEE20 pKa = 4.64DD21 pKa = 4.0TLTSYY26 pKa = 10.45VPKK29 pKa = 10.4RR30 pKa = 11.84KK31 pKa = 9.65EE32 pKa = 3.77NEE34 pKa = 4.36DD35 pKa = 3.36IEE37 pKa = 4.69TFIDD41 pKa = 3.86DD42 pKa = 3.88SSNFEE47 pKa = 3.7IPFFYY52 pKa = 9.93MIFVMVILALVYY64 pKa = 10.49IFFIQQ69 pKa = 3.52
Molecular weight: 8.35 kDa
Isoelectric point according different methods:
Protein with the highest isoelectric point:
>tr|A0A2H4UUI7|A0A2H4UUI7_9VIRU Uncharacterized protein OS=Bodo saltans virus OX=2024608 GN=BMW23_0484 PE=4 SV=1
MM1 pKa = 7.43KK2 pKa = 10.48AEE4 pKa = 4.23CTVGRR9 pKa = 11.84RR10 pKa = 11.84QVDD13 pKa = 2.94KK14 pKa = 10.58FQRR17 pKa = 11.84VDD19 pKa = 3.59PLRR22 pKa = 11.84GLYY25 pKa = 9.35ILKK28 pKa = 10.0RR29 pKa = 11.84YY30 pKa = 9.38IMRR33 pKa = 11.84AA34 pKa = 3.16
MM1 pKa = 7.43KK2 pKa = 10.48AEE4 pKa = 4.23CTVGRR9 pKa = 11.84RR10 pKa = 11.84QVDD13 pKa = 2.94KK14 pKa = 10.58FQRR17 pKa = 11.84VDD19 pKa = 3.59PLRR22 pKa = 11.84GLYY25 pKa = 9.35ILKK28 pKa = 10.0RR29 pKa = 11.84YY30 pKa = 9.38IMRR33 pKa = 11.84AA34 pKa = 3.16
Molecular weight: 4.11 kDa
Isoelectric point according different methods:
Peptides (in silico digests for buttom-up proteomics)
Below you can find in silico digests of the whole proteome with Trypsin, Chymotrypsin, Trypsin+LysC, LysN, ArgC proteases suitable for different mass spec machines.| Try ESI |
 |
|---|
| ChTry ESI |
|
|---|
| ArgC ESI |
|
|---|
| LysN ESI |
|
|---|
| TryLysC ESI |
|
|---|
| Try MALDI |
|
|---|
| ChTry MALDI |
|
|---|
| ArgC MALDI |
|
|---|
| LysN MALDI |
|
|---|
| TryLysC MALDI |
|
|---|
| Try LTQ |
|
|---|
| ChTry LTQ |
|
|---|
| ArgC LTQ |
|
|---|
| LysN LTQ |
|
|---|
| TryLysC LTQ |
|
|---|
| Try MSlow |
|
|---|
| ChTry MSlow |
|
|---|
| ArgC MSlow |
|
|---|
| LysN MSlow |
|
|---|
| TryLysC MSlow |
|
|---|
| Try MShigh |
|
|---|
| ChTry MShigh |
|
|---|
| ArgC MShigh |
|
|---|
| LysN MShigh |
|
|---|
| TryLysC MShigh |
|
|---|
General Statistics
Number of major isoforms |
Number of additional isoforms |
Number of all proteins |
Number of amino acids |
Min. Seq. Length |
Max. Seq. Length |
Avg. Seq. Length |
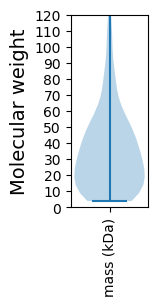
Avg. Mol. Weight |
|---|---|---|---|---|---|---|---|
0 |
387114 |
33 |
4840 |
326.4 |
38.0 |
Amino acid frequency
Ala |
Cys |
Asp |
Glu |
Phe |
Gly |
His |
Ile |
Lys |
Leu |
|---|---|---|---|---|---|---|---|---|---|
3.761 ± 0.101 | 3.023 ± 0.099 |
6.183 ± 0.094 | 6.771 ± 0.115 |
4.539 ± 0.065 | 3.975 ± 0.108 |
2.438 ± 0.054 | 9.643 ± 0.123 |
9.991 ± 0.168 | 7.98 ± 0.057 |
Met |
Asn |
Gln |
Pro |
Arg |
Ser |
Thr |
Val |
Trp |
Tyr |
|---|---|---|---|---|---|---|---|---|---|
2.353 ± 0.048 | 9.828 ± 0.143 |
2.409 ± 0.047 | 3.026 ± 0.073 |
2.543 ± 0.051 | 5.761 ± 0.112 |
5.364 ± 0.191 | 3.867 ± 0.063 |
0.96 ± 0.031 | 5.584 ± 0.068 |
Most of the basic statistics you can see at this page can be downloaded from this CSV file
See this proteome in:

Proteome-pI is available under Creative Commons Attribution-NoDerivs license, for more details see here
| Reference: Kozlowski LP. Proteome-pI 2.0: Proteome Isoelectric Point Database Update. Nucleic Acids Res. 2021, doi: 10.1093/nar/gkab944 | Contact: Lukasz P. Kozlowski |