Jannaschia sp. (strain CCS1)
Taxonomy: cellular organisms; Bacteria; Proteobacteria; Alphaproteobacteria; Rhodobacterales; Roseobacteraceae; Jannaschia; unclassified Jannaschia
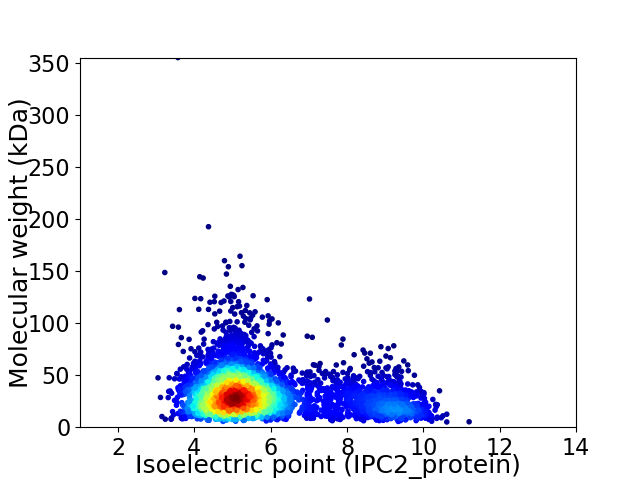
Average proteome isoelectric point is 5.87
Get precalculated fractions of proteins

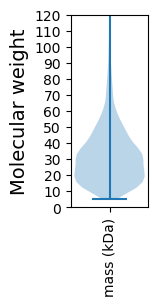
Virtual 2D-PAGE plot for 4271 proteins (isoelectric point calculated using IPC2_protein)
Get csv file with sequences according to given criteria:
* You can choose from 21 different methods for calculating isoelectric point
Summary statistics related to proteome-wise predictions


Protein with the lowest isoelectric point:
>tr|Q28MY1|Q28MY1_JANSC Uncharacterized protein OS=Jannaschia sp. (strain CCS1) OX=290400 GN=Jann_3014 PE=4 SV=1
MM1 pKa = 7.82NIRR4 pKa = 11.84KK5 pKa = 8.91NLTASVSIASMVMASAAPAFADD27 pKa = 4.42GEE29 pKa = 4.71LNLLTWEE36 pKa = 5.49GYY38 pKa = 10.85ADD40 pKa = 4.03PSFIDD45 pKa = 3.9AFTEE49 pKa = 4.15ATGCTVSATYY59 pKa = 10.54VGSNDD64 pKa = 3.5DD65 pKa = 3.56FAPRR69 pKa = 11.84LAAGGGVFDD78 pKa = 6.23LISPSIDD85 pKa = 2.86TTAPLIAAGFVEE97 pKa = 6.47AIDD100 pKa = 3.43TDD102 pKa = 4.11RR103 pKa = 11.84IEE105 pKa = 4.9RR106 pKa = 11.84FDD108 pKa = 4.34EE109 pKa = 4.42IYY111 pKa = 10.9DD112 pKa = 3.66AFRR115 pKa = 11.84TADD118 pKa = 4.34GINADD123 pKa = 3.67GQIYY127 pKa = 9.3GLPYY131 pKa = 9.42AWGAIVFMYY140 pKa = 10.14RR141 pKa = 11.84PDD143 pKa = 3.73MFDD146 pKa = 3.66EE147 pKa = 5.25PPTSIADD154 pKa = 3.49LWDD157 pKa = 3.93PALEE161 pKa = 4.25GRR163 pKa = 11.84VSIWDD168 pKa = 4.0DD169 pKa = 3.15KK170 pKa = 10.9SALYY174 pKa = 10.11VAARR178 pKa = 11.84RR179 pKa = 11.84NGDD182 pKa = 2.94MDD184 pKa = 3.97IYY186 pKa = 11.19NLTDD190 pKa = 3.43AQIAAAQEE198 pKa = 4.19SLLEE202 pKa = 3.79QRR204 pKa = 11.84PNIRR208 pKa = 11.84RR209 pKa = 11.84YY210 pKa = 8.58WSTAGEE216 pKa = 4.15LVDD219 pKa = 5.59LYY221 pKa = 11.4LSGEE225 pKa = 4.31VWVSNTWAGYY235 pKa = 10.0QSALLEE241 pKa = 4.35AEE243 pKa = 3.92GMEE246 pKa = 4.15VVEE249 pKa = 7.15FIPEE253 pKa = 3.85EE254 pKa = 3.97NAEE257 pKa = 3.85GWMDD261 pKa = 2.76SWMIVADD268 pKa = 5.41SPNQDD273 pKa = 3.01CAYY276 pKa = 9.56EE277 pKa = 3.96FLNMSISEE285 pKa = 4.36LGQCGVANVNGYY297 pKa = 10.4SVTNPVAARR306 pKa = 11.84NCMTDD311 pKa = 3.0EE312 pKa = 4.19QFASLHH318 pKa = 5.78QDD320 pKa = 3.01DD321 pKa = 5.1PGYY324 pKa = 10.31IDD326 pKa = 6.32SLLLWEE332 pKa = 4.56NLGPRR337 pKa = 11.84LGDD340 pKa = 4.04YY341 pKa = 10.52VSAWNAVKK349 pKa = 10.45AQQ351 pKa = 3.31
MM1 pKa = 7.82NIRR4 pKa = 11.84KK5 pKa = 8.91NLTASVSIASMVMASAAPAFADD27 pKa = 4.42GEE29 pKa = 4.71LNLLTWEE36 pKa = 5.49GYY38 pKa = 10.85ADD40 pKa = 4.03PSFIDD45 pKa = 3.9AFTEE49 pKa = 4.15ATGCTVSATYY59 pKa = 10.54VGSNDD64 pKa = 3.5DD65 pKa = 3.56FAPRR69 pKa = 11.84LAAGGGVFDD78 pKa = 6.23LISPSIDD85 pKa = 2.86TTAPLIAAGFVEE97 pKa = 6.47AIDD100 pKa = 3.43TDD102 pKa = 4.11RR103 pKa = 11.84IEE105 pKa = 4.9RR106 pKa = 11.84FDD108 pKa = 4.34EE109 pKa = 4.42IYY111 pKa = 10.9DD112 pKa = 3.66AFRR115 pKa = 11.84TADD118 pKa = 4.34GINADD123 pKa = 3.67GQIYY127 pKa = 9.3GLPYY131 pKa = 9.42AWGAIVFMYY140 pKa = 10.14RR141 pKa = 11.84PDD143 pKa = 3.73MFDD146 pKa = 3.66EE147 pKa = 5.25PPTSIADD154 pKa = 3.49LWDD157 pKa = 3.93PALEE161 pKa = 4.25GRR163 pKa = 11.84VSIWDD168 pKa = 4.0DD169 pKa = 3.15KK170 pKa = 10.9SALYY174 pKa = 10.11VAARR178 pKa = 11.84RR179 pKa = 11.84NGDD182 pKa = 2.94MDD184 pKa = 3.97IYY186 pKa = 11.19NLTDD190 pKa = 3.43AQIAAAQEE198 pKa = 4.19SLLEE202 pKa = 3.79QRR204 pKa = 11.84PNIRR208 pKa = 11.84RR209 pKa = 11.84YY210 pKa = 8.58WSTAGEE216 pKa = 4.15LVDD219 pKa = 5.59LYY221 pKa = 11.4LSGEE225 pKa = 4.31VWVSNTWAGYY235 pKa = 10.0QSALLEE241 pKa = 4.35AEE243 pKa = 3.92GMEE246 pKa = 4.15VVEE249 pKa = 7.15FIPEE253 pKa = 3.85EE254 pKa = 3.97NAEE257 pKa = 3.85GWMDD261 pKa = 2.76SWMIVADD268 pKa = 5.41SPNQDD273 pKa = 3.01CAYY276 pKa = 9.56EE277 pKa = 3.96FLNMSISEE285 pKa = 4.36LGQCGVANVNGYY297 pKa = 10.4SVTNPVAARR306 pKa = 11.84NCMTDD311 pKa = 3.0EE312 pKa = 4.19QFASLHH318 pKa = 5.78QDD320 pKa = 3.01DD321 pKa = 5.1PGYY324 pKa = 10.31IDD326 pKa = 6.32SLLLWEE332 pKa = 4.56NLGPRR337 pKa = 11.84LGDD340 pKa = 4.04YY341 pKa = 10.52VSAWNAVKK349 pKa = 10.45AQQ351 pKa = 3.31
Molecular weight: 38.42 kDa
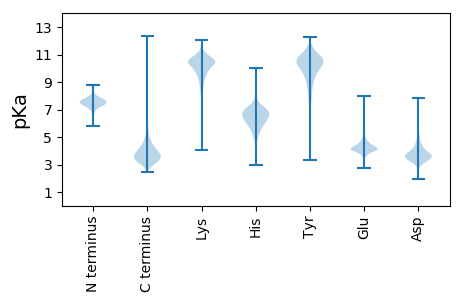
Isoelectric point according different methods:
Protein with the highest isoelectric point:
>tr|Q28UQ9|Q28UQ9_JANSC MOSC OS=Jannaschia sp. (strain CCS1) OX=290400 GN=Jann_0636 PE=4 SV=1
MM1 pKa = 7.69SKK3 pKa = 9.01RR4 pKa = 11.84TFQPSNLVRR13 pKa = 11.84KK14 pKa = 8.83HH15 pKa = 4.64RR16 pKa = 11.84HH17 pKa = 3.91GFRR20 pKa = 11.84ARR22 pKa = 11.84MATKK26 pKa = 10.37AGRR29 pKa = 11.84KK30 pKa = 8.54ILNARR35 pKa = 11.84RR36 pKa = 11.84ARR38 pKa = 11.84GRR40 pKa = 11.84KK41 pKa = 9.07SLSAA45 pKa = 3.93
MM1 pKa = 7.69SKK3 pKa = 9.01RR4 pKa = 11.84TFQPSNLVRR13 pKa = 11.84KK14 pKa = 8.83HH15 pKa = 4.64RR16 pKa = 11.84HH17 pKa = 3.91GFRR20 pKa = 11.84ARR22 pKa = 11.84MATKK26 pKa = 10.37AGRR29 pKa = 11.84KK30 pKa = 8.54ILNARR35 pKa = 11.84RR36 pKa = 11.84ARR38 pKa = 11.84GRR40 pKa = 11.84KK41 pKa = 9.07SLSAA45 pKa = 3.93
Molecular weight: 5.21 kDa
Isoelectric point according different methods:
Peptides (in silico digests for buttom-up proteomics)
Below you can find in silico digests of the whole proteome with Trypsin, Chymotrypsin, Trypsin+LysC, LysN, ArgC proteases suitable for different mass spec machines.| Try ESI |
 |
|---|
| ChTry ESI |
 |
|---|
| ArgC ESI |
 |
|---|
| LysN ESI |
 |
|---|
| TryLysC ESI |
 |
|---|
| Try MALDI |
 |
|---|
| ChTry MALDI |
 |
|---|
| ArgC MALDI |
 |
|---|
| LysN MALDI |
 |
|---|
| TryLysC MALDI |
 |
|---|
| Try LTQ |
 |
|---|
| ChTry LTQ |
 |
|---|
| ArgC LTQ |
 |
|---|
| LysN LTQ |
 |
|---|
| TryLysC LTQ |
 |
|---|
| Try MSlow |
 |
|---|
| ChTry MSlow |
 |
|---|
| ArgC MSlow |
 |
|---|
| LysN MSlow |
 |
|---|
| TryLysC MSlow |
 |
|---|
| Try MShigh |
 |
|---|
| ChTry MShigh |
 |
|---|
| ArgC MShigh |
 |
|---|
| LysN MShigh |
 |
|---|
| TryLysC MShigh |
 |
|---|
General Statistics
Number of major isoforms |
Number of additional isoforms |
Number of all proteins |
Number of amino acids |
Min. Seq. Length |
Max. Seq. Length |
Avg. Seq. Length |
Avg. Mol. Weight |
|---|---|---|---|---|---|---|---|
0 |
1324290 |
41 |
3486 |
310.1 |
33.52 |
Amino acid frequency
Ala |
Cys |
Asp |
Glu |
Phe |
Gly |
His |
Ile |
Lys |
Leu |
|---|---|---|---|---|---|---|---|---|---|
12.575 ± 0.046 | 0.913 ± 0.01 |
6.449 ± 0.035 | 5.546 ± 0.037 |
3.753 ± 0.025 | 8.798 ± 0.036 |
2.114 ± 0.021 | 5.24 ± 0.027 |
2.551 ± 0.032 | 9.873 ± 0.041 |
Met |
Asn |
Gln |
Pro |
Arg |
Ser |
Thr |
Val |
Trp |
Tyr |
|---|---|---|---|---|---|---|---|---|---|
2.859 ± 0.02 | 2.535 ± 0.02 |
5.257 ± 0.025 | 3.169 ± 0.02 |
6.523 ± 0.037 | 5.06 ± 0.024 |
5.877 ± 0.037 | 7.32 ± 0.028 |
1.419 ± 0.015 | 2.171 ± 0.018 |
Most of the basic statistics you can see at this page can be downloaded from this CSV file
Proteome-pI is available under Creative Commons Attribution-NoDerivs license, for more details see here
| Reference: Kozlowski LP. Proteome-pI 2.0: Proteome Isoelectric Point Database Update. Nucleic Acids Res. 2021, doi: 10.1093/nar/gkab944 | Contact: Lukasz P. Kozlowski |
