Pseudonocardia asaccharolytica DSM 44247 = NBRC 16224
Taxonomy: cellular organisms; Bacteria; Terrabacteria group; Actinobacteria; Actinomycetia; Pseudonocardiales; Pseudonocardiaceae; Pseudonocardia; Pseudonocardia asaccharolytica
Average proteome isoelectric point is 6.53
Get precalculated fractions of proteins

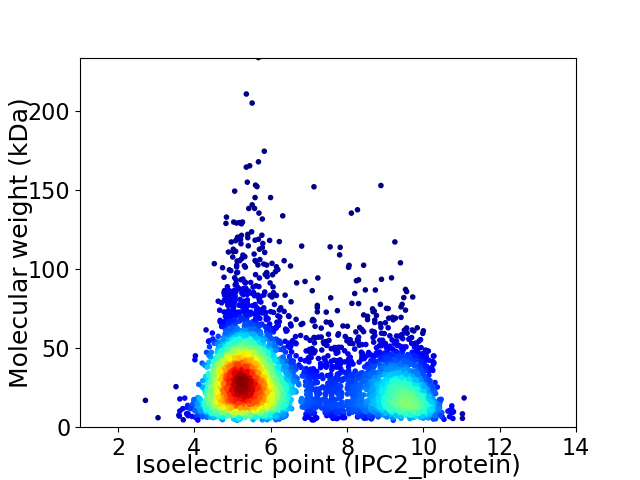
Virtual 2D-PAGE plot for 4883 proteins (isoelectric point calculated using IPC2_protein)
Get csv file with sequences according to given criteria:
* You can choose from 21 different methods for calculating isoelectric point
Summary statistics related to proteome-wise predictions


Protein with the lowest isoelectric point:
>tr|A0A511CUP0|A0A511CUP0_9PSEU 50S ribosomal protein L7/L12 OS=Pseudonocardia asaccharolytica DSM 44247 = NBRC 16224 OX=1123024 GN=rplL PE=3 SV=1
MM1 pKa = 7.45SPDD4 pKa = 4.29ALPPDD9 pKa = 4.56PFAGDD14 pKa = 3.48PHH16 pKa = 7.93DD17 pKa = 4.76PALSLDD23 pKa = 4.2GPDD26 pKa = 3.17ATEE29 pKa = 4.29PEE31 pKa = 4.39VLSEE35 pKa = 4.01QEE37 pKa = 3.48RR38 pKa = 11.84DD39 pKa = 3.74EE40 pKa = 4.41IVADD44 pKa = 3.98LADD47 pKa = 3.94LAVYY51 pKa = 9.68QALLEE56 pKa = 4.28TRR58 pKa = 11.84GVRR61 pKa = 11.84GIVVDD66 pKa = 4.84CGDD69 pKa = 3.76CGEE72 pKa = 4.22QHH74 pKa = 4.97FHH76 pKa = 5.74EE77 pKa = 4.93WSLLRR82 pKa = 11.84ASLQQLLDD90 pKa = 3.76EE91 pKa = 4.95GQMRR95 pKa = 11.84PHH97 pKa = 6.8EE98 pKa = 4.45PAFDD102 pKa = 5.17PDD104 pKa = 3.67PADD107 pKa = 3.48YY108 pKa = 9.58VTWEE112 pKa = 4.03YY113 pKa = 11.24CRR115 pKa = 11.84GYY117 pKa = 11.37ADD119 pKa = 5.23ALLSDD124 pKa = 4.14SS125 pKa = 4.25
MM1 pKa = 7.45SPDD4 pKa = 4.29ALPPDD9 pKa = 4.56PFAGDD14 pKa = 3.48PHH16 pKa = 7.93DD17 pKa = 4.76PALSLDD23 pKa = 4.2GPDD26 pKa = 3.17ATEE29 pKa = 4.29PEE31 pKa = 4.39VLSEE35 pKa = 4.01QEE37 pKa = 3.48RR38 pKa = 11.84DD39 pKa = 3.74EE40 pKa = 4.41IVADD44 pKa = 3.98LADD47 pKa = 3.94LAVYY51 pKa = 9.68QALLEE56 pKa = 4.28TRR58 pKa = 11.84GVRR61 pKa = 11.84GIVVDD66 pKa = 4.84CGDD69 pKa = 3.76CGEE72 pKa = 4.22QHH74 pKa = 4.97FHH76 pKa = 5.74EE77 pKa = 4.93WSLLRR82 pKa = 11.84ASLQQLLDD90 pKa = 3.76EE91 pKa = 4.95GQMRR95 pKa = 11.84PHH97 pKa = 6.8EE98 pKa = 4.45PAFDD102 pKa = 5.17PDD104 pKa = 3.67PADD107 pKa = 3.48YY108 pKa = 9.58VTWEE112 pKa = 4.03YY113 pKa = 11.24CRR115 pKa = 11.84GYY117 pKa = 11.37ADD119 pKa = 5.23ALLSDD124 pKa = 4.14SS125 pKa = 4.25
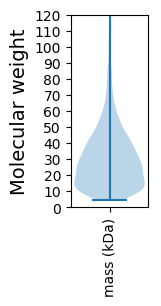
Molecular weight: 13.76 kDa
Isoelectric point according different methods:
Protein with the highest isoelectric point:
>tr|A0A511D4E9|A0A511D4E9_9PSEU Uncharacterized protein OS=Pseudonocardia asaccharolytica DSM 44247 = NBRC 16224 OX=1123024 GN=PA7_31900 PE=4 SV=1
MM1 pKa = 7.7GSPGTGVLRR10 pKa = 11.84VVRR13 pKa = 11.84ATAVTATVVGFAAAAHH29 pKa = 5.57TLGGASVPGPTLAAGSALVLLIVSAVSGQRR59 pKa = 11.84FSGAALLALLAVGQFALHH77 pKa = 6.16HH78 pKa = 6.29VFTIGAPAHH87 pKa = 6.66AMGQGSASPAMLVAHH102 pKa = 6.1VVATVVSTGVLLRR115 pKa = 11.84GEE117 pKa = 4.11RR118 pKa = 11.84ALWAMWSWLWRR129 pKa = 11.84LLPTAVTLWLPVPARR144 pKa = 11.84PPRR147 pKa = 11.84RR148 pKa = 11.84WTRR151 pKa = 11.84RR152 pKa = 11.84APRR155 pKa = 11.84PRR157 pKa = 11.84LVLLLTAARR166 pKa = 11.84RR167 pKa = 11.84GPPAPARR174 pKa = 11.84PLSAASS180 pKa = 3.36
MM1 pKa = 7.7GSPGTGVLRR10 pKa = 11.84VVRR13 pKa = 11.84ATAVTATVVGFAAAAHH29 pKa = 5.57TLGGASVPGPTLAAGSALVLLIVSAVSGQRR59 pKa = 11.84FSGAALLALLAVGQFALHH77 pKa = 6.16HH78 pKa = 6.29VFTIGAPAHH87 pKa = 6.66AMGQGSASPAMLVAHH102 pKa = 6.1VVATVVSTGVLLRR115 pKa = 11.84GEE117 pKa = 4.11RR118 pKa = 11.84ALWAMWSWLWRR129 pKa = 11.84LLPTAVTLWLPVPARR144 pKa = 11.84PPRR147 pKa = 11.84RR148 pKa = 11.84WTRR151 pKa = 11.84RR152 pKa = 11.84APRR155 pKa = 11.84PRR157 pKa = 11.84LVLLLTAARR166 pKa = 11.84RR167 pKa = 11.84GPPAPARR174 pKa = 11.84PLSAASS180 pKa = 3.36
Molecular weight: 18.45 kDa
Isoelectric point according different methods:
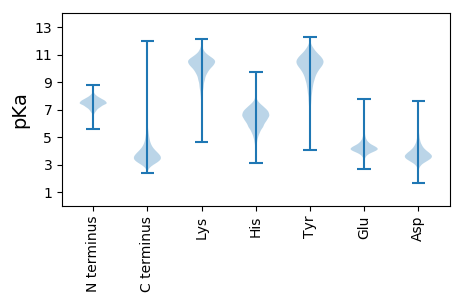
Peptides (in silico digests for buttom-up proteomics)
Below you can find in silico digests of the whole proteome with Trypsin, Chymotrypsin, Trypsin+LysC, LysN, ArgC proteases suitable for different mass spec machines.| Try ESI |
 |
|---|
| ChTry ESI |
 |
|---|
| ArgC ESI |
 |
|---|
| LysN ESI |
 |
|---|
| TryLysC ESI |
 |
|---|
| Try MALDI |
 |
|---|
| ChTry MALDI |
 |
|---|
| ArgC MALDI |
 |
|---|
| LysN MALDI |
 |
|---|
| TryLysC MALDI |
 |
|---|
| Try LTQ |
 |
|---|
| ChTry LTQ |
 |
|---|
| ArgC LTQ |
 |
|---|
| LysN LTQ |
 |
|---|
| TryLysC LTQ |
 |
|---|
| Try MSlow |
 |
|---|
| ChTry MSlow |
 |
|---|
| ArgC MSlow |
 |
|---|
| LysN MSlow |
 |
|---|
| TryLysC MSlow |
 |
|---|
| Try MShigh |
 |
|---|
| ChTry MShigh |
 |
|---|
| ArgC MShigh |
 |
|---|
| LysN MShigh |
 |
|---|
| TryLysC MShigh |
 |
|---|
General Statistics
Number of major isoforms |
Number of additional isoforms |
Number of all proteins |
Number of amino acids |
Min. Seq. Length |
Max. Seq. Length |
Avg. Seq. Length |
Avg. Mol. Weight |
|---|---|---|---|---|---|---|---|
0 |
1461661 |
39 |
2138 |
299.3 |
32.01 |
Amino acid frequency
Ala |
Cys |
Asp |
Glu |
Phe |
Gly |
His |
Ile |
Lys |
Leu |
|---|---|---|---|---|---|---|---|---|---|
13.992 ± 0.058 | 0.871 ± 0.011 |
5.954 ± 0.029 | 5.565 ± 0.034 |
2.644 ± 0.021 | 9.472 ± 0.031 |
2.273 ± 0.015 | 3.51 ± 0.022 |
1.527 ± 0.022 | 10.528 ± 0.043 |
Met |
Asn |
Gln |
Pro |
Arg |
Ser |
Thr |
Val |
Trp |
Tyr |
|---|---|---|---|---|---|---|---|---|---|
1.743 ± 0.012 | 1.601 ± 0.016 |
6.299 ± 0.03 | 2.628 ± 0.019 |
8.756 ± 0.04 | 4.651 ± 0.022 |
5.656 ± 0.026 | 8.997 ± 0.039 |
1.465 ± 0.015 | 1.867 ± 0.017 |
Most of the basic statistics you can see at this page can be downloaded from this CSV file
Proteome-pI is available under Creative Commons Attribution-NoDerivs license, for more details see here
| Reference: Kozlowski LP. Proteome-pI 2.0: Proteome Isoelectric Point Database Update. Nucleic Acids Res. 2021, doi: 10.1093/nar/gkab944 | Contact: Lukasz P. Kozlowski |
