Leek white stripe virus
Taxonomy: Viruses; Riboviria; Orthornavirae; Kitrinoviricota; Tolucaviricetes; Tolivirales; Tombusviridae; Procedovirinae; Betanecrovirus
Average proteome isoelectric point is 7.67
Get precalculated fractions of proteins

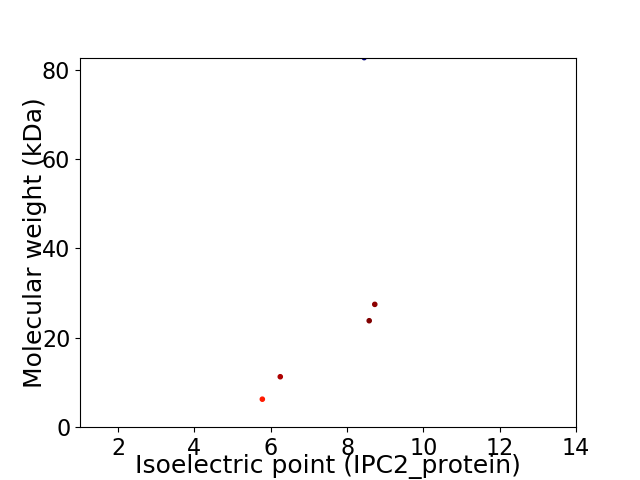
Virtual 2D-PAGE plot for 5 proteins (isoelectric point calculated using IPC2_protein)
Get csv file with sequences according to given criteria:
* You can choose from 21 different methods for calculating isoelectric point
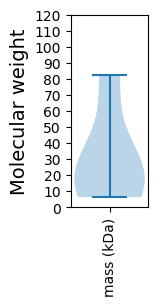
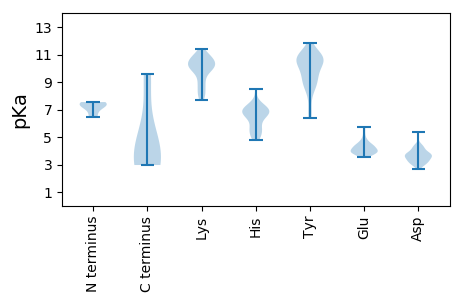
Summary statistics related to proteome-wise predictions


Protein with the lowest isoelectric point:
>tr|Q83106|Q83106_9TOMB Capsid protein OS=Leek white stripe virus OX=45224 GN=ORF 5 PE=3 SV=1
MM1 pKa = 7.14VIVVRR6 pKa = 11.84EE7 pKa = 3.95SSFPLLAVWIIVIVLVAVIGALLQTPPEE35 pKa = 4.51TINQVFNEE43 pKa = 4.27DD44 pKa = 3.24HH45 pKa = 7.25HH46 pKa = 5.86KK47 pKa = 8.4TQYY50 pKa = 11.06INIGKK55 pKa = 8.89PP56 pKa = 2.96
MM1 pKa = 7.14VIVVRR6 pKa = 11.84EE7 pKa = 3.95SSFPLLAVWIIVIVLVAVIGALLQTPPEE35 pKa = 4.51TINQVFNEE43 pKa = 4.27DD44 pKa = 3.24HH45 pKa = 7.25HH46 pKa = 5.86KK47 pKa = 8.4TQYY50 pKa = 11.06INIGKK55 pKa = 8.89PP56 pKa = 2.96
Molecular weight: 6.27 kDa
Isoelectric point according different methods:
Protein with the highest isoelectric point:
>tr|Q83103|Q83103_9TOMB RNA-directed RNA polymerase OS=Leek white stripe virus OX=45224 GN=ORF 2 PE=3 SV=1
MM1 pKa = 7.41HH2 pKa = 7.39TPQCIARR9 pKa = 11.84FGTTCHH15 pKa = 4.79THH17 pKa = 5.26IRR19 pKa = 11.84TARR22 pKa = 11.84LLYY25 pKa = 10.88VKK27 pKa = 7.83TTYY30 pKa = 9.7FQRR33 pKa = 11.84FLFMFFVYY41 pKa = 10.33SAVPVLFVPILFIAFFHH58 pKa = 7.09RR59 pKa = 11.84FFKK62 pKa = 10.83LQLGFSPEE70 pKa = 3.82ATALMHH76 pKa = 6.85RR77 pKa = 11.84FVDD80 pKa = 4.27LFSRR84 pKa = 11.84DD85 pKa = 3.91DD86 pKa = 3.7EE87 pKa = 4.36PVITEE92 pKa = 4.09TSCNVDD98 pKa = 4.14FLPGPEE104 pKa = 3.92SRR106 pKa = 11.84KK107 pKa = 9.98EE108 pKa = 3.68NLVAPKK114 pKa = 10.07RR115 pKa = 11.84RR116 pKa = 11.84NHH118 pKa = 6.37YY119 pKa = 8.86IVKK122 pKa = 9.89VAMAAKK128 pKa = 9.93SQVGLLGNSRR138 pKa = 11.84ANEE141 pKa = 3.65LVYY144 pKa = 10.97ARR146 pKa = 11.84LCRR149 pKa = 11.84EE150 pKa = 3.88EE151 pKa = 4.09MVKK154 pKa = 10.57HH155 pKa = 5.76GVRR158 pKa = 11.84PSHH161 pKa = 6.92IARR164 pKa = 11.84MVPLAVDD171 pKa = 3.6CHH173 pKa = 6.7CFIPMDD179 pKa = 4.4EE180 pKa = 5.71DD181 pKa = 3.35IMAAEE186 pKa = 4.35MMRR189 pKa = 11.84TDD191 pKa = 3.09VMRR194 pKa = 11.84SRR196 pKa = 11.84RR197 pKa = 11.84KK198 pKa = 10.73DD199 pKa = 3.16MGDD202 pKa = 3.06SHH204 pKa = 7.48AKK206 pKa = 9.59
MM1 pKa = 7.41HH2 pKa = 7.39TPQCIARR9 pKa = 11.84FGTTCHH15 pKa = 4.79THH17 pKa = 5.26IRR19 pKa = 11.84TARR22 pKa = 11.84LLYY25 pKa = 10.88VKK27 pKa = 7.83TTYY30 pKa = 9.7FQRR33 pKa = 11.84FLFMFFVYY41 pKa = 10.33SAVPVLFVPILFIAFFHH58 pKa = 7.09RR59 pKa = 11.84FFKK62 pKa = 10.83LQLGFSPEE70 pKa = 3.82ATALMHH76 pKa = 6.85RR77 pKa = 11.84FVDD80 pKa = 4.27LFSRR84 pKa = 11.84DD85 pKa = 3.91DD86 pKa = 3.7EE87 pKa = 4.36PVITEE92 pKa = 4.09TSCNVDD98 pKa = 4.14FLPGPEE104 pKa = 3.92SRR106 pKa = 11.84KK107 pKa = 9.98EE108 pKa = 3.68NLVAPKK114 pKa = 10.07RR115 pKa = 11.84RR116 pKa = 11.84NHH118 pKa = 6.37YY119 pKa = 8.86IVKK122 pKa = 9.89VAMAAKK128 pKa = 9.93SQVGLLGNSRR138 pKa = 11.84ANEE141 pKa = 3.65LVYY144 pKa = 10.97ARR146 pKa = 11.84LCRR149 pKa = 11.84EE150 pKa = 3.88EE151 pKa = 4.09MVKK154 pKa = 10.57HH155 pKa = 5.76GVRR158 pKa = 11.84PSHH161 pKa = 6.92IARR164 pKa = 11.84MVPLAVDD171 pKa = 3.6CHH173 pKa = 6.7CFIPMDD179 pKa = 4.4EE180 pKa = 5.71DD181 pKa = 3.35IMAAEE186 pKa = 4.35MMRR189 pKa = 11.84TDD191 pKa = 3.09VMRR194 pKa = 11.84SRR196 pKa = 11.84RR197 pKa = 11.84KK198 pKa = 10.73DD199 pKa = 3.16MGDD202 pKa = 3.06SHH204 pKa = 7.48AKK206 pKa = 9.59
Molecular weight: 23.82 kDa
Isoelectric point according different methods:
Peptides (in silico digests for buttom-up proteomics)
Below you can find in silico digests of the whole proteome with Trypsin, Chymotrypsin, Trypsin+LysC, LysN, ArgC proteases suitable for different mass spec machines.| Try ESI |
 |
|---|
| ChTry ESI |
 |
|---|
| ArgC ESI |
 |
|---|
| LysN ESI |
 |
|---|
| TryLysC ESI |
 |
|---|
| Try MALDI |
 |
|---|
| ChTry MALDI |
 |
|---|
| ArgC MALDI |
 |
|---|
| LysN MALDI |
 |
|---|
| TryLysC MALDI |
 |
|---|
| Try LTQ |
 |
|---|
| ChTry LTQ |
 |
|---|
| ArgC LTQ |
 |
|---|
| LysN LTQ |
 |
|---|
| TryLysC LTQ |
 |
|---|
| Try MSlow |
 |
|---|
| ChTry MSlow |
 |
|---|
| ArgC MSlow |
 |
|---|
| LysN MSlow |
 |
|---|
| TryLysC MSlow |
 |
|---|
| Try MShigh |
 |
|---|
| ChTry MShigh |
 |
|---|
| ArgC MShigh |
 |
|---|
| LysN MShigh |
 |
|---|
| TryLysC MShigh |
 |
|---|
General Statistics
Number of major isoforms |
Number of additional isoforms |
Number of all proteins |
Number of amino acids |
Min. Seq. Length |
Max. Seq. Length |
Avg. Seq. Length |
Avg. Mol. Weight |
|---|---|---|---|---|---|---|---|
0 |
1340 |
56 |
727 |
268.0 |
30.31 |
Amino acid frequency
Ala |
Cys |
Asp |
Glu |
Phe |
Gly |
His |
Ile |
Lys |
Leu |
|---|---|---|---|---|---|---|---|---|---|
6.567 ± 0.621 | 2.09 ± 0.348 |
4.328 ± 0.34 | 5.299 ± 0.72 |
6.791 ± 0.482 | 6.343 ± 1.034 |
3.06 ± 0.574 | 5.0 ± 0.917 |
5.149 ± 0.28 | 8.06 ± 0.997 |
Met |
Asn |
Gln |
Pro |
Arg |
Ser |
Thr |
Val |
Trp |
Tyr |
|---|---|---|---|---|---|---|---|---|---|
3.731 ± 0.544 | 4.403 ± 1.32 |
5.373 ± 0.333 | 2.836 ± 0.282 |
6.94 ± 1.064 | 6.94 ± 1.206 |
5.597 ± 0.15 | 7.761 ± 0.894 |
0.896 ± 0.299 | 2.761 ± 0.343 |
Most of the basic statistics you can see at this page can be downloaded from this CSV file
Proteome-pI is available under Creative Commons Attribution-NoDerivs license, for more details see here
| Reference: Kozlowski LP. Proteome-pI 2.0: Proteome Isoelectric Point Database Update. Nucleic Acids Res. 2021, doi: 10.1093/nar/gkab944 | Contact: Lukasz P. Kozlowski |
