Aurantimonas aggregata
Taxonomy: cellular organisms; Bacteria; Proteobacteria; Alphaproteobacteria; Hyphomicrobiales; Aurantimonadaceae; Aurantimonas
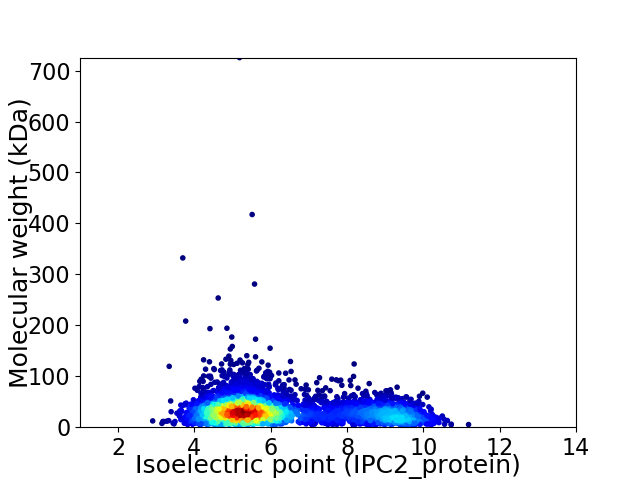
Average proteome isoelectric point is 6.25
Get precalculated fractions of proteins

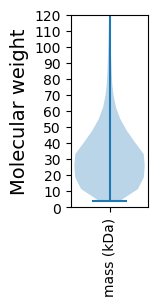
Virtual 2D-PAGE plot for 4495 proteins (isoelectric point calculated using IPC2_protein)
Get csv file with sequences according to given criteria:
* You can choose from 21 different methods for calculating isoelectric point
Summary statistics related to proteome-wise predictions


Protein with the lowest isoelectric point:
>tr|A0A6L9MF89|A0A6L9MF89_9RHIZ Small ribosomal subunit biogenesis GTPase RsgA OS=Aurantimonas aggregata OX=2047720 GN=rsgA PE=3 SV=1
MM1 pKa = 8.04RR2 pKa = 11.84ILTAAAGLALLLGTSLGAAAADD24 pKa = 3.97VYY26 pKa = 11.4APYY29 pKa = 10.31DD30 pKa = 3.95PNPAPPAPAAFDD42 pKa = 3.88YY43 pKa = 11.4GDD45 pKa = 3.47TDD47 pKa = 3.9LVIFLGIGGTVTPQYY62 pKa = 11.16DD63 pKa = 3.46GADD66 pKa = 3.86DD67 pKa = 4.47YY68 pKa = 11.41EE69 pKa = 4.59LSPRR73 pKa = 11.84PIINVEE79 pKa = 3.96YY80 pKa = 10.72LSIPGIGAFGGKK92 pKa = 9.81DD93 pKa = 3.19GLGFSIGPSFGYY105 pKa = 10.24VGEE108 pKa = 4.59RR109 pKa = 11.84DD110 pKa = 3.58ASDD113 pKa = 3.86FDD115 pKa = 4.52GLDD118 pKa = 3.56GLDD121 pKa = 4.89DD122 pKa = 4.06VDD124 pKa = 4.18DD125 pKa = 4.33TYY127 pKa = 11.93EE128 pKa = 4.22LGVRR132 pKa = 11.84AGYY135 pKa = 9.75EE136 pKa = 3.58WDD138 pKa = 3.23HH139 pKa = 8.19AEE141 pKa = 3.52IYY143 pKa = 10.57GAVRR147 pKa = 11.84YY148 pKa = 9.82AFGGADD154 pKa = 3.41GVVGDD159 pKa = 4.77IGANLISRR167 pKa = 11.84PTEE170 pKa = 3.77RR171 pKa = 11.84LVLKK175 pKa = 10.53AGPTASFASSDD186 pKa = 3.6YY187 pKa = 8.55MDD189 pKa = 4.99AYY191 pKa = 10.95FGVTTSEE198 pKa = 4.2SFNTGGRR205 pKa = 11.84LEE207 pKa = 5.02PYY209 pKa = 10.56DD210 pKa = 4.05PDD212 pKa = 4.65GGFKK216 pKa = 10.66SVGVAASARR225 pKa = 11.84YY226 pKa = 8.42EE227 pKa = 4.22VYY229 pKa = 10.42TDD231 pKa = 3.07WFVDD235 pKa = 3.11ADD237 pKa = 3.37ASYY240 pKa = 11.75ARR242 pKa = 11.84LIGDD246 pKa = 4.28AKK248 pKa = 10.77DD249 pKa = 3.69SPIVEE254 pKa = 4.71AGDD257 pKa = 3.81ANQFTFGLGVSKK269 pKa = 10.74RR270 pKa = 11.84FSLDD274 pKa = 2.6LWW276 pKa = 4.14
MM1 pKa = 8.04RR2 pKa = 11.84ILTAAAGLALLLGTSLGAAAADD24 pKa = 3.97VYY26 pKa = 11.4APYY29 pKa = 10.31DD30 pKa = 3.95PNPAPPAPAAFDD42 pKa = 3.88YY43 pKa = 11.4GDD45 pKa = 3.47TDD47 pKa = 3.9LVIFLGIGGTVTPQYY62 pKa = 11.16DD63 pKa = 3.46GADD66 pKa = 3.86DD67 pKa = 4.47YY68 pKa = 11.41EE69 pKa = 4.59LSPRR73 pKa = 11.84PIINVEE79 pKa = 3.96YY80 pKa = 10.72LSIPGIGAFGGKK92 pKa = 9.81DD93 pKa = 3.19GLGFSIGPSFGYY105 pKa = 10.24VGEE108 pKa = 4.59RR109 pKa = 11.84DD110 pKa = 3.58ASDD113 pKa = 3.86FDD115 pKa = 4.52GLDD118 pKa = 3.56GLDD121 pKa = 4.89DD122 pKa = 4.06VDD124 pKa = 4.18DD125 pKa = 4.33TYY127 pKa = 11.93EE128 pKa = 4.22LGVRR132 pKa = 11.84AGYY135 pKa = 9.75EE136 pKa = 3.58WDD138 pKa = 3.23HH139 pKa = 8.19AEE141 pKa = 3.52IYY143 pKa = 10.57GAVRR147 pKa = 11.84YY148 pKa = 9.82AFGGADD154 pKa = 3.41GVVGDD159 pKa = 4.77IGANLISRR167 pKa = 11.84PTEE170 pKa = 3.77RR171 pKa = 11.84LVLKK175 pKa = 10.53AGPTASFASSDD186 pKa = 3.6YY187 pKa = 8.55MDD189 pKa = 4.99AYY191 pKa = 10.95FGVTTSEE198 pKa = 4.2SFNTGGRR205 pKa = 11.84LEE207 pKa = 5.02PYY209 pKa = 10.56DD210 pKa = 4.05PDD212 pKa = 4.65GGFKK216 pKa = 10.66SVGVAASARR225 pKa = 11.84YY226 pKa = 8.42EE227 pKa = 4.22VYY229 pKa = 10.42TDD231 pKa = 3.07WFVDD235 pKa = 3.11ADD237 pKa = 3.37ASYY240 pKa = 11.75ARR242 pKa = 11.84LIGDD246 pKa = 4.28AKK248 pKa = 10.77DD249 pKa = 3.69SPIVEE254 pKa = 4.71AGDD257 pKa = 3.81ANQFTFGLGVSKK269 pKa = 10.74RR270 pKa = 11.84FSLDD274 pKa = 2.6LWW276 pKa = 4.14
Molecular weight: 28.97 kDa
Isoelectric point according different methods:
Protein with the highest isoelectric point:
>tr|A0A6L9MF82|A0A6L9MF82_9RHIZ Uracil phosphoribosyltransferase OS=Aurantimonas aggregata OX=2047720 GN=upp PE=3 SV=1
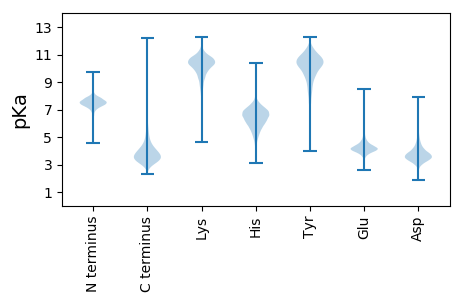
MM1 pKa = 7.35KK2 pKa = 9.4RR3 pKa = 11.84TYY5 pKa = 10.2QPSRR9 pKa = 11.84LVRR12 pKa = 11.84KK13 pKa = 8.99RR14 pKa = 11.84RR15 pKa = 11.84HH16 pKa = 4.7GFRR19 pKa = 11.84SRR21 pKa = 11.84MATTGGRR28 pKa = 11.84KK29 pKa = 9.29VIAARR34 pKa = 11.84RR35 pKa = 11.84ARR37 pKa = 11.84GRR39 pKa = 11.84KK40 pKa = 9.03RR41 pKa = 11.84LSAA44 pKa = 4.03
MM1 pKa = 7.35KK2 pKa = 9.4RR3 pKa = 11.84TYY5 pKa = 10.2QPSRR9 pKa = 11.84LVRR12 pKa = 11.84KK13 pKa = 8.99RR14 pKa = 11.84RR15 pKa = 11.84HH16 pKa = 4.7GFRR19 pKa = 11.84SRR21 pKa = 11.84MATTGGRR28 pKa = 11.84KK29 pKa = 9.29VIAARR34 pKa = 11.84RR35 pKa = 11.84ARR37 pKa = 11.84GRR39 pKa = 11.84KK40 pKa = 9.03RR41 pKa = 11.84LSAA44 pKa = 4.03
Molecular weight: 5.18 kDa
Isoelectric point according different methods:
Peptides (in silico digests for buttom-up proteomics)
Below you can find in silico digests of the whole proteome with Trypsin, Chymotrypsin, Trypsin+LysC, LysN, ArgC proteases suitable for different mass spec machines.| Try ESI |
 |
|---|
| ChTry ESI |
 |
|---|
| ArgC ESI |
 |
|---|
| LysN ESI |
 |
|---|
| TryLysC ESI |
 |
|---|
| Try MALDI |
 |
|---|
| ChTry MALDI |
 |
|---|
| ArgC MALDI |
 |
|---|
| LysN MALDI |
 |
|---|
| TryLysC MALDI |
 |
|---|
| Try LTQ |
 |
|---|
| ChTry LTQ |
 |
|---|
| ArgC LTQ |
 |
|---|
| LysN LTQ |
 |
|---|
| TryLysC LTQ |
 |
|---|
| Try MSlow |
 |
|---|
| ChTry MSlow |
 |
|---|
| ArgC MSlow |
 |
|---|
| LysN MSlow |
 |
|---|
| TryLysC MSlow |
 |
|---|
| Try MShigh |
 |
|---|
| ChTry MShigh |
 |
|---|
| ArgC MShigh |
 |
|---|
| LysN MShigh |
 |
|---|
| TryLysC MShigh |
 |
|---|
General Statistics
Number of major isoforms |
Number of additional isoforms |
Number of all proteins |
Number of amino acids |
Min. Seq. Length |
Max. Seq. Length |
Avg. Seq. Length |
Avg. Mol. Weight |
|---|---|---|---|---|---|---|---|
0 |
1392481 |
34 |
6931 |
309.8 |
33.43 |
Amino acid frequency
Ala |
Cys |
Asp |
Glu |
Phe |
Gly |
His |
Ile |
Lys |
Leu |
|---|---|---|---|---|---|---|---|---|---|
13.207 ± 0.055 | 0.779 ± 0.011 |
5.92 ± 0.038 | 5.945 ± 0.035 |
3.763 ± 0.024 | 8.844 ± 0.039 |
1.892 ± 0.018 | 5.146 ± 0.029 |
2.603 ± 0.025 | 10.064 ± 0.043 |
Met |
Asn |
Gln |
Pro |
Arg |
Ser |
Thr |
Val |
Trp |
Tyr |
|---|---|---|---|---|---|---|---|---|---|
2.45 ± 0.019 | 2.279 ± 0.022 |
5.286 ± 0.028 | 2.843 ± 0.019 |
7.432 ± 0.045 | 5.286 ± 0.023 |
5.323 ± 0.021 | 7.585 ± 0.031 |
1.252 ± 0.017 | 2.1 ± 0.019 |
Most of the basic statistics you can see at this page can be downloaded from this CSV file
Proteome-pI is available under Creative Commons Attribution-NoDerivs license, for more details see here
| Reference: Kozlowski LP. Proteome-pI 2.0: Proteome Isoelectric Point Database Update. Nucleic Acids Res. 2021, doi: 10.1093/nar/gkab944 | Contact: Lukasz P. Kozlowski |
