Sedimentisphaera salicampi
Taxonomy: cellular organisms; Bacteria; PVC group; Planctomycetes; Phycisphaerae; Sedimentisphaerales; Sedimentisphaeraceae; Sedimentisphaera
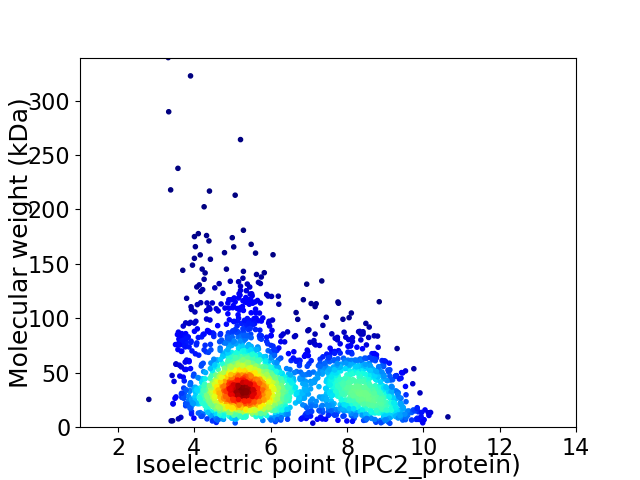
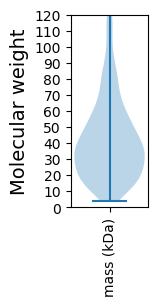
Average proteome isoelectric point is 6.18
Get precalculated fractions of proteins

Virtual 2D-PAGE plot for 2335 proteins (isoelectric point calculated using IPC2_protein)
Get csv file with sequences according to given criteria:
* You can choose from 21 different methods for calculating isoelectric point
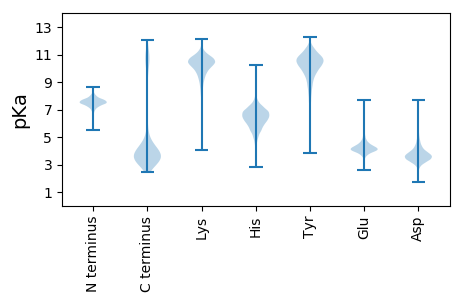
Summary statistics related to proteome-wise predictions


Protein with the lowest isoelectric point:
>tr|A0A1W6LJS1|A0A1W6LJS1_9BACT Efflux pump membrane transporter BepG OS=Sedimentisphaera salicampi OX=1941349 GN=bepG PE=4 SV=1
MM1 pKa = 7.36KK2 pKa = 10.45RR3 pKa = 11.84LISLMLGIVLSLSLCSFGDD22 pKa = 4.08YY23 pKa = 9.29ITIDD27 pKa = 3.41SDD29 pKa = 3.72LSDD32 pKa = 3.36WAGIDD37 pKa = 3.6YY38 pKa = 9.89TDD40 pKa = 3.87QGTKK44 pKa = 10.09SGPDD48 pKa = 3.1GGSYY52 pKa = 10.03SLRR55 pKa = 11.84TTYY58 pKa = 10.89DD59 pKa = 3.13SQNLYY64 pKa = 10.15IAVDD68 pKa = 3.79RR69 pKa = 11.84SSTGRR74 pKa = 11.84ILGDD78 pKa = 2.95TGTNYY83 pKa = 11.03DD84 pKa = 3.96DD85 pKa = 3.99TSYY88 pKa = 11.66SPDD91 pKa = 3.34DD92 pKa = 3.76SFFLAFDD99 pKa = 3.35VDD101 pKa = 4.9GITDD105 pKa = 3.49SGGSSNVTLANGEE118 pKa = 4.08TDD120 pKa = 3.03GMSISFGGDD129 pKa = 3.1NLPDD133 pKa = 4.19IIYY136 pKa = 10.35AFSGGGNWFTYY147 pKa = 7.54STWNGSEE154 pKa = 3.78WTGDD158 pKa = 2.94ADD160 pKa = 3.49NWVEE164 pKa = 4.64PEE166 pKa = 4.15DD167 pKa = 4.04SSIGVSYY174 pKa = 10.91GDD176 pKa = 3.91SGNDD180 pKa = 3.09GDD182 pKa = 5.07EE183 pKa = 4.19FAIPLQDD190 pKa = 3.11IGSPSGDD197 pKa = 2.59IMAWAWMAKK206 pKa = 8.89EE207 pKa = 3.49SHH209 pKa = 6.51YY210 pKa = 10.83YY211 pKa = 9.62IEE213 pKa = 4.57AAWGFSSGAQPTAYY227 pKa = 10.19DD228 pKa = 3.85GMSVAVPEE236 pKa = 4.44PFTLGLLGIGSIALRR251 pKa = 11.84RR252 pKa = 11.84RR253 pKa = 11.84RR254 pKa = 11.84KK255 pKa = 9.57SS256 pKa = 3.07
MM1 pKa = 7.36KK2 pKa = 10.45RR3 pKa = 11.84LISLMLGIVLSLSLCSFGDD22 pKa = 4.08YY23 pKa = 9.29ITIDD27 pKa = 3.41SDD29 pKa = 3.72LSDD32 pKa = 3.36WAGIDD37 pKa = 3.6YY38 pKa = 9.89TDD40 pKa = 3.87QGTKK44 pKa = 10.09SGPDD48 pKa = 3.1GGSYY52 pKa = 10.03SLRR55 pKa = 11.84TTYY58 pKa = 10.89DD59 pKa = 3.13SQNLYY64 pKa = 10.15IAVDD68 pKa = 3.79RR69 pKa = 11.84SSTGRR74 pKa = 11.84ILGDD78 pKa = 2.95TGTNYY83 pKa = 11.03DD84 pKa = 3.96DD85 pKa = 3.99TSYY88 pKa = 11.66SPDD91 pKa = 3.34DD92 pKa = 3.76SFFLAFDD99 pKa = 3.35VDD101 pKa = 4.9GITDD105 pKa = 3.49SGGSSNVTLANGEE118 pKa = 4.08TDD120 pKa = 3.03GMSISFGGDD129 pKa = 3.1NLPDD133 pKa = 4.19IIYY136 pKa = 10.35AFSGGGNWFTYY147 pKa = 7.54STWNGSEE154 pKa = 3.78WTGDD158 pKa = 2.94ADD160 pKa = 3.49NWVEE164 pKa = 4.64PEE166 pKa = 4.15DD167 pKa = 4.04SSIGVSYY174 pKa = 10.91GDD176 pKa = 3.91SGNDD180 pKa = 3.09GDD182 pKa = 5.07EE183 pKa = 4.19FAIPLQDD190 pKa = 3.11IGSPSGDD197 pKa = 2.59IMAWAWMAKK206 pKa = 8.89EE207 pKa = 3.49SHH209 pKa = 6.51YY210 pKa = 10.83YY211 pKa = 9.62IEE213 pKa = 4.57AAWGFSSGAQPTAYY227 pKa = 10.19DD228 pKa = 3.85GMSVAVPEE236 pKa = 4.44PFTLGLLGIGSIALRR251 pKa = 11.84RR252 pKa = 11.84RR253 pKa = 11.84RR254 pKa = 11.84KK255 pKa = 9.57SS256 pKa = 3.07
Molecular weight: 27.38 kDa
Isoelectric point according different methods:
Protein with the highest isoelectric point:
>tr|A0A1W6LJ69|A0A1W6LJ69_9BACT Ig-like domain-containing protein OS=Sedimentisphaera salicampi OX=1941349 GN=STSP1_00204 PE=4 SV=1
MM1 pKa = 7.73KK2 pKa = 10.23NQRR5 pKa = 11.84RR6 pKa = 11.84NKK8 pKa = 9.39KK9 pKa = 9.71RR10 pKa = 11.84RR11 pKa = 11.84TATIRR16 pKa = 11.84EE17 pKa = 3.97QNQCRR22 pKa = 11.84FCRR25 pKa = 11.84AKK27 pKa = 10.01TEE29 pKa = 4.12YY30 pKa = 10.33VDD32 pKa = 4.82YY33 pKa = 10.81MDD35 pKa = 5.74IDD37 pKa = 4.07TLSKK41 pKa = 10.99LLTNRR46 pKa = 11.84GKK48 pKa = 9.86IYY50 pKa = 10.11SRR52 pKa = 11.84KK53 pKa = 9.59RR54 pKa = 11.84SGNCASCQRR63 pKa = 11.84KK64 pKa = 7.67VQNAIKK70 pKa = 9.77RR71 pKa = 11.84ARR73 pKa = 11.84YY74 pKa = 8.34MGLLPYY80 pKa = 8.91QTT82 pKa = 4.47
MM1 pKa = 7.73KK2 pKa = 10.23NQRR5 pKa = 11.84RR6 pKa = 11.84NKK8 pKa = 9.39KK9 pKa = 9.71RR10 pKa = 11.84RR11 pKa = 11.84TATIRR16 pKa = 11.84EE17 pKa = 3.97QNQCRR22 pKa = 11.84FCRR25 pKa = 11.84AKK27 pKa = 10.01TEE29 pKa = 4.12YY30 pKa = 10.33VDD32 pKa = 4.82YY33 pKa = 10.81MDD35 pKa = 5.74IDD37 pKa = 4.07TLSKK41 pKa = 10.99LLTNRR46 pKa = 11.84GKK48 pKa = 9.86IYY50 pKa = 10.11SRR52 pKa = 11.84KK53 pKa = 9.59RR54 pKa = 11.84SGNCASCQRR63 pKa = 11.84KK64 pKa = 7.67VQNAIKK70 pKa = 9.77RR71 pKa = 11.84ARR73 pKa = 11.84YY74 pKa = 8.34MGLLPYY80 pKa = 8.91QTT82 pKa = 4.47
Molecular weight: 9.82 kDa
Isoelectric point according different methods:
Peptides (in silico digests for buttom-up proteomics)
Below you can find in silico digests of the whole proteome with Trypsin, Chymotrypsin, Trypsin+LysC, LysN, ArgC proteases suitable for different mass spec machines.| Try ESI |
 |
|---|
| ChTry ESI |
 |
|---|
| ArgC ESI |
 |
|---|
| LysN ESI |
 |
|---|
| TryLysC ESI |
 |
|---|
| Try MALDI |
 |
|---|
| ChTry MALDI |
 |
|---|
| ArgC MALDI |
 |
|---|
| LysN MALDI |
 |
|---|
| TryLysC MALDI |
 |
|---|
| Try LTQ |
 |
|---|
| ChTry LTQ |
 |
|---|
| ArgC LTQ |
 |
|---|
| LysN LTQ |
 |
|---|
| TryLysC LTQ |
 |
|---|
| Try MSlow |
 |
|---|
| ChTry MSlow |
 |
|---|
| ArgC MSlow |
 |
|---|
| LysN MSlow |
 |
|---|
| TryLysC MSlow |
 |
|---|
| Try MShigh |
 |
|---|
| ChTry MShigh |
 |
|---|
| ArgC MShigh |
 |
|---|
| LysN MShigh |
 |
|---|
| TryLysC MShigh |
 |
|---|
General Statistics
Number of major isoforms |
Number of additional isoforms |
Number of all proteins |
Number of amino acids |
Min. Seq. Length |
Max. Seq. Length |
Avg. Seq. Length |
Avg. Mol. Weight |
|---|---|---|---|---|---|---|---|
0 |
937580 |
34 |
3411 |
401.5 |
44.79 |
Amino acid frequency
Ala |
Cys |
Asp |
Glu |
Phe |
Gly |
His |
Ile |
Lys |
Leu |
|---|---|---|---|---|---|---|---|---|---|
7.652 ± 0.062 | 1.403 ± 0.019 |
6.024 ± 0.047 | 7.405 ± 0.046 |
4.44 ± 0.035 | 7.645 ± 0.055 |
1.644 ± 0.022 | 6.536 ± 0.038 |
6.58 ± 0.065 | 8.453 ± 0.053 |
Met |
Asn |
Gln |
Pro |
Arg |
Ser |
Thr |
Val |
Trp |
Tyr |
|---|---|---|---|---|---|---|---|---|---|
2.343 ± 0.023 | 4.693 ± 0.033 |
4.055 ± 0.03 | 3.268 ± 0.025 |
4.612 ± 0.042 | 7.26 ± 0.045 |
4.769 ± 0.042 | 6.156 ± 0.036 |
1.404 ± 0.025 | 3.658 ± 0.037 |
Most of the basic statistics you can see at this page can be downloaded from this CSV file
Proteome-pI is available under Creative Commons Attribution-NoDerivs license, for more details see here
| Reference: Kozlowski LP. Proteome-pI 2.0: Proteome Isoelectric Point Database Update. Nucleic Acids Res. 2021, doi: 10.1093/nar/gkab944 | Contact: Lukasz P. Kozlowski |
