Calibrachoa mottle virus
Taxonomy: Viruses; Riboviria; Orthornavirae; Kitrinoviricota; Tolucaviricetes; Tolivirales; Tombusviridae; Procedovirinae; Alphacarmovirus
Average proteome isoelectric point is 8.41
Get precalculated fractions of proteins

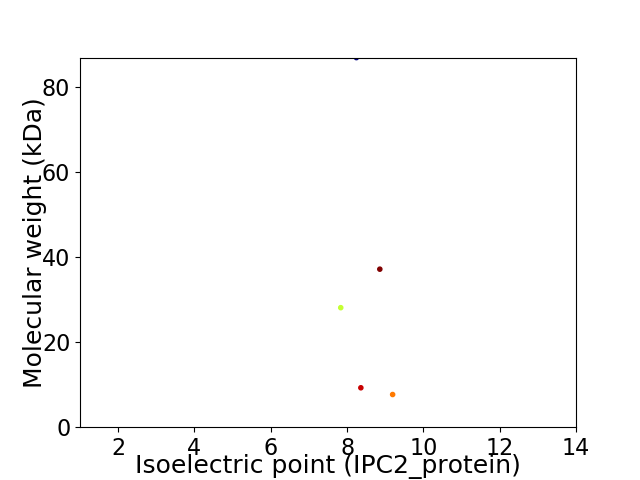
Virtual 2D-PAGE plot for 5 proteins (isoelectric point calculated using IPC2_protein)
Get csv file with sequences according to given criteria:
* You can choose from 21 different methods for calculating isoelectric point
Summary statistics related to proteome-wise predictions


Protein with the lowest isoelectric point:
>tr|C7E3L3|C7E3L3_9TOMB p8 OS=Calibrachoa mottle virus OX=204928 GN=P8 PE=4 SV=1
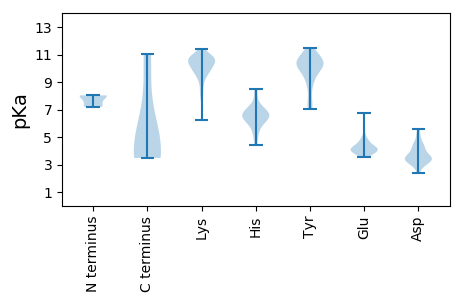
MM1 pKa = 8.01GILQLAKK8 pKa = 9.28EE9 pKa = 4.18LTVGGVCCTTLLCVGVAALEE29 pKa = 4.05VRR31 pKa = 11.84LALGAYY37 pKa = 7.36EE38 pKa = 4.74FNKK41 pKa = 10.03QCISNVRR48 pKa = 11.84GFIEE52 pKa = 4.74SRR54 pKa = 11.84GQSHH58 pKa = 7.13PSEE61 pKa = 4.2PKK63 pKa = 7.9YY64 pKa = 11.13AKK66 pKa = 10.74AEE68 pKa = 3.95VSPFQAEE75 pKa = 4.04LDD77 pKa = 4.13DD78 pKa = 5.55DD79 pKa = 5.17LEE81 pKa = 6.74DD82 pKa = 4.13DD83 pKa = 4.39AEE85 pKa = 4.13MRR87 pKa = 11.84NYY89 pKa = 10.54LEE91 pKa = 3.93KK92 pKa = 11.05HH93 pKa = 5.27EE94 pKa = 5.74DD95 pKa = 3.51KK96 pKa = 11.3EE97 pKa = 4.39KK98 pKa = 10.93DD99 pKa = 3.51DD100 pKa = 3.86EE101 pKa = 4.69GKK103 pKa = 10.67VVVKK107 pKa = 9.87NVRR110 pKa = 11.84TTLPRR115 pKa = 11.84NRR117 pKa = 11.84HH118 pKa = 4.44TKK120 pKa = 10.15GKK122 pKa = 9.1FLKK125 pKa = 10.64RR126 pKa = 11.84LVADD130 pKa = 4.46TKK132 pKa = 10.88NHH134 pKa = 6.8FGGTPTPTDD143 pKa = 3.56ANRR146 pKa = 11.84LAVMKK151 pKa = 10.44YY152 pKa = 7.02MVGRR156 pKa = 11.84CRR158 pKa = 11.84EE159 pKa = 3.71HH160 pKa = 8.46HH161 pKa = 6.43MVDD164 pKa = 2.8LHH166 pKa = 6.49IRR168 pKa = 11.84QVTEE172 pKa = 3.55LAKK175 pKa = 10.69AAVFTPDD182 pKa = 2.92ILEE185 pKa = 4.29VQSVQLLNSYY195 pKa = 8.84PAYY198 pKa = 10.19RR199 pKa = 11.84RR200 pKa = 11.84RR201 pKa = 11.84CALHH205 pKa = 6.82KK206 pKa = 10.26AHH208 pKa = 6.61QVQVWKK214 pKa = 10.5EE215 pKa = 3.53LLTNCFHH222 pKa = 7.1KK223 pKa = 10.91DD224 pKa = 2.4AWEE227 pKa = 4.25YY228 pKa = 10.37IWFRR232 pKa = 11.84MNGGLARR239 pKa = 11.84SPFQFHH245 pKa = 6.95KK246 pKa = 11.03
MM1 pKa = 8.01GILQLAKK8 pKa = 9.28EE9 pKa = 4.18LTVGGVCCTTLLCVGVAALEE29 pKa = 4.05VRR31 pKa = 11.84LALGAYY37 pKa = 7.36EE38 pKa = 4.74FNKK41 pKa = 10.03QCISNVRR48 pKa = 11.84GFIEE52 pKa = 4.74SRR54 pKa = 11.84GQSHH58 pKa = 7.13PSEE61 pKa = 4.2PKK63 pKa = 7.9YY64 pKa = 11.13AKK66 pKa = 10.74AEE68 pKa = 3.95VSPFQAEE75 pKa = 4.04LDD77 pKa = 4.13DD78 pKa = 5.55DD79 pKa = 5.17LEE81 pKa = 6.74DD82 pKa = 4.13DD83 pKa = 4.39AEE85 pKa = 4.13MRR87 pKa = 11.84NYY89 pKa = 10.54LEE91 pKa = 3.93KK92 pKa = 11.05HH93 pKa = 5.27EE94 pKa = 5.74DD95 pKa = 3.51KK96 pKa = 11.3EE97 pKa = 4.39KK98 pKa = 10.93DD99 pKa = 3.51DD100 pKa = 3.86EE101 pKa = 4.69GKK103 pKa = 10.67VVVKK107 pKa = 9.87NVRR110 pKa = 11.84TTLPRR115 pKa = 11.84NRR117 pKa = 11.84HH118 pKa = 4.44TKK120 pKa = 10.15GKK122 pKa = 9.1FLKK125 pKa = 10.64RR126 pKa = 11.84LVADD130 pKa = 4.46TKK132 pKa = 10.88NHH134 pKa = 6.8FGGTPTPTDD143 pKa = 3.56ANRR146 pKa = 11.84LAVMKK151 pKa = 10.44YY152 pKa = 7.02MVGRR156 pKa = 11.84CRR158 pKa = 11.84EE159 pKa = 3.71HH160 pKa = 8.46HH161 pKa = 6.43MVDD164 pKa = 2.8LHH166 pKa = 6.49IRR168 pKa = 11.84QVTEE172 pKa = 3.55LAKK175 pKa = 10.69AAVFTPDD182 pKa = 2.92ILEE185 pKa = 4.29VQSVQLLNSYY195 pKa = 8.84PAYY198 pKa = 10.19RR199 pKa = 11.84RR200 pKa = 11.84RR201 pKa = 11.84CALHH205 pKa = 6.82KK206 pKa = 10.26AHH208 pKa = 6.61QVQVWKK214 pKa = 10.5EE215 pKa = 3.53LLTNCFHH222 pKa = 7.1KK223 pKa = 10.91DD224 pKa = 2.4AWEE227 pKa = 4.25YY228 pKa = 10.37IWFRR232 pKa = 11.84MNGGLARR239 pKa = 11.84SPFQFHH245 pKa = 6.95KK246 pKa = 11.03
Molecular weight: 28.12 kDa
Isoelectric point according different methods:
Protein with the highest isoelectric point:
>tr|C7E3L4|C7E3L4_9TOMB p9 OS=Calibrachoa mottle virus OX=204928 GN=P9 PE=4 SV=1
MM1 pKa = 7.2EE2 pKa = 5.74RR3 pKa = 11.84EE4 pKa = 4.06HH5 pKa = 6.2PTINKK10 pKa = 9.83AISTKK15 pKa = 10.33EE16 pKa = 3.53KK17 pKa = 10.65SKK19 pKa = 10.75QLNSSKK25 pKa = 11.0DD26 pKa = 3.49KK27 pKa = 11.3NKK29 pKa = 10.66LSGKK33 pKa = 8.19LTAAKK38 pKa = 10.12AVANEE43 pKa = 3.87QARR46 pKa = 11.84GSVYY50 pKa = 10.52GGSFTNVARR59 pKa = 11.84EE60 pKa = 3.89IKK62 pKa = 9.86MEE64 pKa = 3.82IHH66 pKa = 6.22FHH68 pKa = 5.69FF69 pKa = 5.06
MM1 pKa = 7.2EE2 pKa = 5.74RR3 pKa = 11.84EE4 pKa = 4.06HH5 pKa = 6.2PTINKK10 pKa = 9.83AISTKK15 pKa = 10.33EE16 pKa = 3.53KK17 pKa = 10.65SKK19 pKa = 10.75QLNSSKK25 pKa = 11.0DD26 pKa = 3.49KK27 pKa = 11.3NKK29 pKa = 10.66LSGKK33 pKa = 8.19LTAAKK38 pKa = 10.12AVANEE43 pKa = 3.87QARR46 pKa = 11.84GSVYY50 pKa = 10.52GGSFTNVARR59 pKa = 11.84EE60 pKa = 3.89IKK62 pKa = 9.86MEE64 pKa = 3.82IHH66 pKa = 6.22FHH68 pKa = 5.69FF69 pKa = 5.06
Molecular weight: 7.69 kDa
Isoelectric point according different methods:
Peptides (in silico digests for buttom-up proteomics)
Below you can find in silico digests of the whole proteome with Trypsin, Chymotrypsin, Trypsin+LysC, LysN, ArgC proteases suitable for different mass spec machines.| Try ESI |
 |
|---|
| ChTry ESI |
 |
|---|
| ArgC ESI |
 |
|---|
| LysN ESI |
 |
|---|
| TryLysC ESI |
 |
|---|
| Try MALDI |
 |
|---|
| ChTry MALDI |
 |
|---|
| ArgC MALDI |
 |
|---|
| LysN MALDI |
 |
|---|
| TryLysC MALDI |
 |
|---|
| Try LTQ |
 |
|---|
| ChTry LTQ |
 |
|---|
| ArgC LTQ |
 |
|---|
| LysN LTQ |
 |
|---|
| TryLysC LTQ |
 |
|---|
| Try MSlow |
 |
|---|
| ChTry MSlow |
 |
|---|
| ArgC MSlow |
 |
|---|
| LysN MSlow |
 |
|---|
| TryLysC MSlow |
 |
|---|
| Try MShigh |
 |
|---|
| ChTry MShigh |
 |
|---|
| ArgC MShigh |
 |
|---|
| LysN MShigh |
 |
|---|
| TryLysC MShigh |
 |
|---|
General Statistics
Number of major isoforms |
Number of additional isoforms |
Number of all proteins |
Number of amino acids |
Min. Seq. Length |
Max. Seq. Length |
Avg. Seq. Length |
Avg. Mol. Weight |
|---|---|---|---|---|---|---|---|
0 |
1502 |
69 |
762 |
300.4 |
33.85 |
Amino acid frequency
Ala |
Cys |
Asp |
Glu |
Phe |
Gly |
His |
Ile |
Lys |
Leu |
|---|---|---|---|---|---|---|---|---|---|
7.19 ± 0.533 | 2.397 ± 0.66 |
4.461 ± 0.322 | 5.726 ± 0.825 |
3.928 ± 0.319 | 6.658 ± 0.352 |
2.73 ± 0.715 | 4.993 ± 0.711 |
7.457 ± 0.592 | 8.455 ± 0.364 |
Met |
Asn |
Gln |
Pro |
Arg |
Ser |
Thr |
Val |
Trp |
Tyr |
|---|---|---|---|---|---|---|---|---|---|
2.53 ± 0.271 | 4.128 ± 0.544 |
4.727 ± 0.476 | 3.995 ± 0.597 |
5.925 ± 0.74 | 6.125 ± 1.267 |
6.258 ± 1.544 | 7.124 ± 0.443 |
1.398 ± 0.23 | 3.728 ± 0.326 |
Most of the basic statistics you can see at this page can be downloaded from this CSV file
Proteome-pI is available under Creative Commons Attribution-NoDerivs license, for more details see here
| Reference: Kozlowski LP. Proteome-pI 2.0: Proteome Isoelectric Point Database Update. Nucleic Acids Res. 2021, doi: 10.1093/nar/gkab944 | Contact: Lukasz P. Kozlowski |
