Trichomalopsis sarcophagae
Taxonomy: cellular organisms; Eukaryota; Opisthokonta; Metazoa; Eumetazoa; Bilateria; Protostomia; Ecdysozoa; Panarthropoda; Arthropoda; Mandibulata; Pancrustacea; Hexapoda; Insecta; Dicondylia; Pterygota; Neoptera; Endopterygota; Hymenoptera; Apocrita; Parasitoida; Chalcidoidea; Pteromalidae; Pteromalinae;
Average proteome isoelectric point is 7.11
Get precalculated fractions of proteins
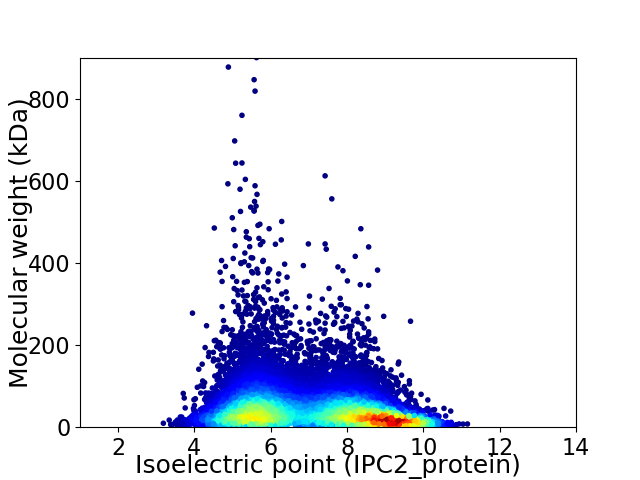
Virtual 2D-PAGE plot for 16064 proteins (isoelectric point calculated using IPC2_protein)
Get csv file with sequences according to given criteria:
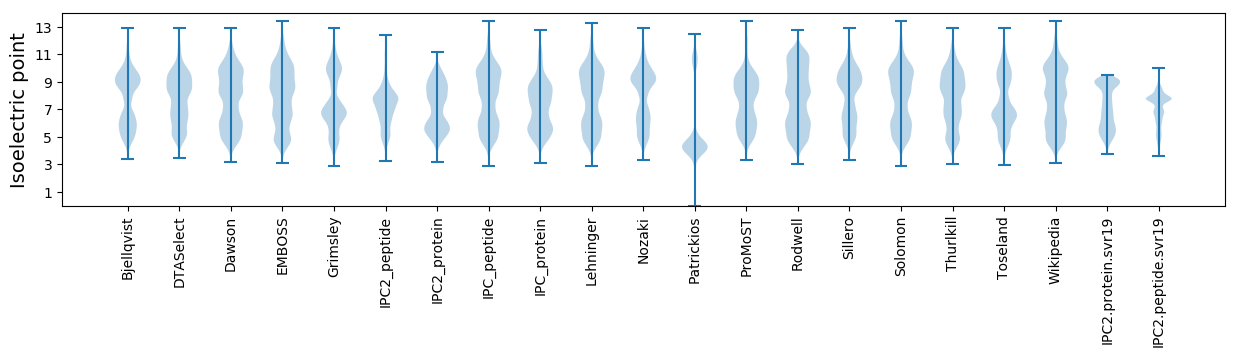
* You can choose from 21 different methods for calculating isoelectric point
Summary statistics related to proteome-wise predictions

Protein with the lowest isoelectric point:
>tr|A0A232FGZ8|A0A232FGZ8_9HYME Coiled-coil domain-containing protein 86 OS=Trichomalopsis sarcophagae OX=543379 GN=TSAR_010731 PE=4 SV=1
MM1 pKa = 7.39LRR3 pKa = 11.84DD4 pKa = 3.84ANDD7 pKa = 5.09DD8 pKa = 3.22IHH10 pKa = 8.6ICICDD15 pKa = 3.86VIFLLHH21 pKa = 5.34VQEE24 pKa = 5.99DD25 pKa = 3.64ITIFQIDD32 pKa = 3.77STYY35 pKa = 8.76EE36 pKa = 3.79TVPEE40 pKa = 4.14VEE42 pKa = 5.44GAMQLCTLIVIYY54 pKa = 10.23HH55 pKa = 5.15GHH57 pKa = 6.09EE58 pKa = 5.5DD59 pKa = 3.05ITIFQIDD66 pKa = 3.77STYY69 pKa = 8.76EE70 pKa = 3.79TVPEE74 pKa = 4.14VEE76 pKa = 5.44GAMQLCTLIVIYY88 pKa = 10.16HH89 pKa = 6.15GHH91 pKa = 7.7PDD93 pKa = 3.61PDD95 pKa = 4.28LDD97 pKa = 4.11PEE99 pKa = 4.44LVIEE103 pKa = 4.7PEE105 pKa = 4.11FEE107 pKa = 4.46LEE109 pKa = 4.27PEE111 pKa = 4.19RR112 pKa = 11.84QLEE115 pKa = 4.3PEE117 pKa = 4.63LEE119 pKa = 4.2LEE121 pKa = 4.45PEE123 pKa = 4.18RR124 pKa = 11.84EE125 pKa = 3.86LDD127 pKa = 4.5LTLEE131 pKa = 4.87DD132 pKa = 4.78CDD134 pKa = 5.03SLIPLDD140 pKa = 5.26AITDD144 pKa = 3.71HH145 pKa = 7.0FLFLALPLLTEE156 pKa = 5.12PDD158 pKa = 3.92PDD160 pKa = 4.51LDD162 pKa = 4.19PEE164 pKa = 4.73PEE166 pKa = 4.37LEE168 pKa = 4.89LEE170 pKa = 4.59PEE172 pKa = 4.14RR173 pKa = 11.84QLEE176 pKa = 4.24PEE178 pKa = 4.1RR179 pKa = 11.84QLEE182 pKa = 4.3PEE184 pKa = 4.59LEE186 pKa = 4.21LEE188 pKa = 4.61PEE190 pKa = 4.39LEE192 pKa = 4.52LDD194 pKa = 4.83LTLEE198 pKa = 4.73DD199 pKa = 4.64CGSLIPLDD207 pKa = 5.06AITDD211 pKa = 3.67RR212 pKa = 11.84RR213 pKa = 11.84GGG215 pKa = 3.46
MM1 pKa = 7.39LRR3 pKa = 11.84DD4 pKa = 3.84ANDD7 pKa = 5.09DD8 pKa = 3.22IHH10 pKa = 8.6ICICDD15 pKa = 3.86VIFLLHH21 pKa = 5.34VQEE24 pKa = 5.99DD25 pKa = 3.64ITIFQIDD32 pKa = 3.77STYY35 pKa = 8.76EE36 pKa = 3.79TVPEE40 pKa = 4.14VEE42 pKa = 5.44GAMQLCTLIVIYY54 pKa = 10.23HH55 pKa = 5.15GHH57 pKa = 6.09EE58 pKa = 5.5DD59 pKa = 3.05ITIFQIDD66 pKa = 3.77STYY69 pKa = 8.76EE70 pKa = 3.79TVPEE74 pKa = 4.14VEE76 pKa = 5.44GAMQLCTLIVIYY88 pKa = 10.16HH89 pKa = 6.15GHH91 pKa = 7.7PDD93 pKa = 3.61PDD95 pKa = 4.28LDD97 pKa = 4.11PEE99 pKa = 4.44LVIEE103 pKa = 4.7PEE105 pKa = 4.11FEE107 pKa = 4.46LEE109 pKa = 4.27PEE111 pKa = 4.19RR112 pKa = 11.84QLEE115 pKa = 4.3PEE117 pKa = 4.63LEE119 pKa = 4.2LEE121 pKa = 4.45PEE123 pKa = 4.18RR124 pKa = 11.84EE125 pKa = 3.86LDD127 pKa = 4.5LTLEE131 pKa = 4.87DD132 pKa = 4.78CDD134 pKa = 5.03SLIPLDD140 pKa = 5.26AITDD144 pKa = 3.71HH145 pKa = 7.0FLFLALPLLTEE156 pKa = 5.12PDD158 pKa = 3.92PDD160 pKa = 4.51LDD162 pKa = 4.19PEE164 pKa = 4.73PEE166 pKa = 4.37LEE168 pKa = 4.89LEE170 pKa = 4.59PEE172 pKa = 4.14RR173 pKa = 11.84QLEE176 pKa = 4.24PEE178 pKa = 4.1RR179 pKa = 11.84QLEE182 pKa = 4.3PEE184 pKa = 4.59LEE186 pKa = 4.21LEE188 pKa = 4.61PEE190 pKa = 4.39LEE192 pKa = 4.52LDD194 pKa = 4.83LTLEE198 pKa = 4.73DD199 pKa = 4.64CGSLIPLDD207 pKa = 5.06AITDD211 pKa = 3.67RR212 pKa = 11.84RR213 pKa = 11.84GGG215 pKa = 3.46
Molecular weight: 24.6 kDa
Isoelectric point according different methods:
Protein with the highest isoelectric point:
>tr|A0A232F0I2|A0A232F0I2_9HYME SMC_N domain-containing protein OS=Trichomalopsis sarcophagae OX=543379 GN=TSAR_000364 PE=3 SV=1
MM1 pKa = 7.55LSLHH5 pKa = 6.55GSRR8 pKa = 11.84SGQHH12 pKa = 6.22APNKK16 pKa = 10.04LRR18 pKa = 11.84LSKK21 pKa = 10.3PNRR24 pKa = 11.84VRR26 pKa = 11.84AGKK29 pKa = 10.04SRR31 pKa = 11.84LFLAPLSLQLPGVSTRR47 pKa = 11.84GRR49 pKa = 11.84GKK51 pKa = 10.64VILIVSTQVATHH63 pKa = 5.13TTRR66 pKa = 11.84PTRR69 pKa = 11.84HH70 pKa = 5.62FAA72 pKa = 3.72
MM1 pKa = 7.55LSLHH5 pKa = 6.55GSRR8 pKa = 11.84SGQHH12 pKa = 6.22APNKK16 pKa = 10.04LRR18 pKa = 11.84LSKK21 pKa = 10.3PNRR24 pKa = 11.84VRR26 pKa = 11.84AGKK29 pKa = 10.04SRR31 pKa = 11.84LFLAPLSLQLPGVSTRR47 pKa = 11.84GRR49 pKa = 11.84GKK51 pKa = 10.64VILIVSTQVATHH63 pKa = 5.13TTRR66 pKa = 11.84PTRR69 pKa = 11.84HH70 pKa = 5.62FAA72 pKa = 3.72
Molecular weight: 7.86 kDa
Isoelectric point according different methods:
Peptides (in silico digests for buttom-up proteomics)
Below you can find in silico digests of the whole proteome with Trypsin, Chymotrypsin, Trypsin+LysC, LysN, ArgC proteases suitable for different mass spec machines.| Try ESI |
 |
|---|
| ChTry ESI |
|
|---|
| ArgC ESI |
|
|---|
| LysN ESI |
|
|---|
| TryLysC ESI |
|
|---|
| Try MALDI |
|
|---|
| ChTry MALDI |
|
|---|
| ArgC MALDI |
|
|---|
| LysN MALDI |
|
|---|
| TryLysC MALDI |
|
|---|
| Try LTQ |
|
|---|
| ChTry LTQ |
|
|---|
| ArgC LTQ |
|
|---|
| LysN LTQ |
|
|---|
| TryLysC LTQ |
|
|---|
| Try MSlow |
|
|---|
| ChTry MSlow |
|
|---|
| ArgC MSlow |
|
|---|
| LysN MSlow |
|
|---|
| TryLysC MSlow |
|
|---|
| Try MShigh |
|
|---|
| ChTry MShigh |
|
|---|
| ArgC MShigh |
|
|---|
| LysN MShigh |
|
|---|
| TryLysC MShigh |
|
|---|
General Statistics
Number of major isoforms |
Number of additional isoforms |
Number of all proteins |
Number of amino acids |
Min. Seq. Length |
Max. Seq. Length |
Avg. Seq. Length |
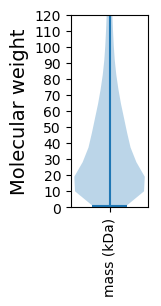
Avg. Mol. Weight |
|---|---|---|---|---|---|---|---|
6836071 |
8 |
7979 |
425.6 |
48.06 |
Amino acid frequency
Ala |
Cys |
Asp |
Glu |
Phe |
Gly |
His |
Ile |
Lys |
Leu |
|---|---|---|---|---|---|---|---|---|---|
6.279 ± 0.022 | 1.98 ± 0.018 |
5.481 ± 0.015 | 6.772 ± 0.024 |
3.834 ± 0.016 | 5.121 ± 0.025 |
2.397 ± 0.009 | 5.897 ± 0.02 |
6.863 ± 0.025 | 9.187 ± 0.028 |
Met |
Asn |
Gln |
Pro |
Arg |
Ser |
Thr |
Val |
Trp |
Tyr |
|---|---|---|---|---|---|---|---|---|---|
2.259 ± 0.01 | 5.227 ± 0.019 |
4.794 ± 0.021 | 4.223 ± 0.021 |
5.463 ± 0.016 | 8.182 ± 0.026 |
5.66 ± 0.017 | 6.086 ± 0.017 |
1.052 ± 0.008 | 3.216 ± 0.014 |
Most of the basic statistics you can see at this page can be downloaded from this CSV file
See this proteome in:

Proteome-pI is available under Creative Commons Attribution-NoDerivs license, for more details see here
| Reference: Kozlowski LP. Proteome-pI 2.0: Proteome Isoelectric Point Database Update. Nucleic Acids Res. 2021, doi: 10.1093/nar/gkab944 | Contact: Lukasz P. Kozlowski |