Tomato associated geminivirus 1
Taxonomy: Viruses; Monodnaviria; Shotokuvirae; Cressdnaviricota; Repensiviricetes; Geplafuvirales; Geminiviridae; unclassified Geminiviridae
Average proteome isoelectric point is 7.1
Get precalculated fractions of proteins

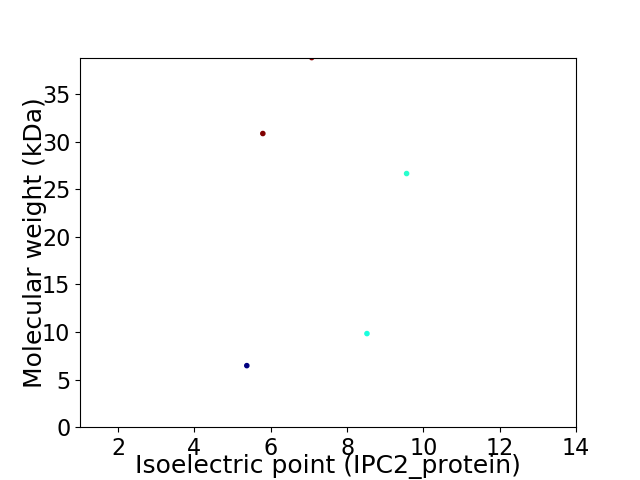
Virtual 2D-PAGE plot for 5 proteins (isoelectric point calculated using IPC2_protein)
Get csv file with sequences according to given criteria:
* You can choose from 21 different methods for calculating isoelectric point
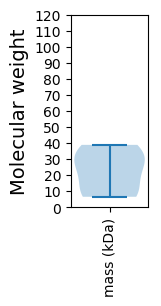
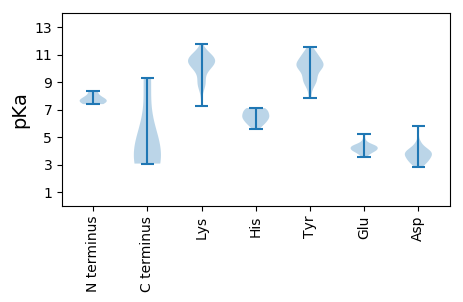
Summary statistics related to proteome-wise predictions


Protein with the lowest isoelectric point:
>tr|A0A223LU27|A0A223LU27_9GEMI Uncharacterized protein OS=Tomato associated geminivirus 1 OX=2027645 PE=4 SV=1
MM1 pKa = 8.36DD2 pKa = 4.19IPLYY6 pKa = 10.19EE7 pKa = 4.28VNDD10 pKa = 3.63YY11 pKa = 11.07PGVYY15 pKa = 10.02NQFLQTCANRR25 pKa = 11.84LISWQLSKK33 pKa = 11.29VQLEE37 pKa = 4.33LDD39 pKa = 3.77VKK41 pKa = 10.9GISIDD46 pKa = 3.91RR47 pKa = 11.84KK48 pKa = 9.0EE49 pKa = 4.12QLLKK53 pKa = 10.98LQQ55 pKa = 4.02
MM1 pKa = 8.36DD2 pKa = 4.19IPLYY6 pKa = 10.19EE7 pKa = 4.28VNDD10 pKa = 3.63YY11 pKa = 11.07PGVYY15 pKa = 10.02NQFLQTCANRR25 pKa = 11.84LISWQLSKK33 pKa = 11.29VQLEE37 pKa = 4.33LDD39 pKa = 3.77VKK41 pKa = 10.9GISIDD46 pKa = 3.91RR47 pKa = 11.84KK48 pKa = 9.0EE49 pKa = 4.12QLLKK53 pKa = 10.98LQQ55 pKa = 4.02
Molecular weight: 6.47 kDa
Isoelectric point according different methods:
Protein with the highest isoelectric point:
>tr|A0A223LU26|A0A223LU26_9GEMI Replication-associated protein OS=Tomato associated geminivirus 1 OX=2027645 PE=3 SV=1
MM1 pKa = 7.8AEE3 pKa = 4.57RR4 pKa = 11.84KK5 pKa = 9.63RR6 pKa = 11.84KK7 pKa = 9.13MEE9 pKa = 3.6WSKK12 pKa = 11.78ANRR15 pKa = 11.84KK16 pKa = 9.07RR17 pKa = 11.84SRR19 pKa = 11.84TTLPRR24 pKa = 11.84NSRR27 pKa = 11.84VYY29 pKa = 10.38ARR31 pKa = 11.84KK32 pKa = 9.65RR33 pKa = 11.84PILRR37 pKa = 11.84GPKK40 pKa = 8.52LTSRR44 pKa = 11.84DD45 pKa = 3.19KK46 pKa = 10.68VYY48 pKa = 10.43TYY50 pKa = 10.13TKK52 pKa = 10.91YY53 pKa = 8.87EE54 pKa = 4.09TLTTAGAVYY63 pKa = 10.11HH64 pKa = 6.49LNSFSQGLANNQRR77 pKa = 11.84ATSVDD82 pKa = 2.79IVHH85 pKa = 6.43NVQLRR90 pKa = 11.84FSVEE94 pKa = 4.03LPTGAMVFCRR104 pKa = 11.84RR105 pKa = 11.84YY106 pKa = 8.56KK107 pKa = 9.93MSWAVVQDD115 pKa = 3.63MMPGDD120 pKa = 4.23SMPAVSDD127 pKa = 3.54IFSMTSPPIEE137 pKa = 4.14GLEE140 pKa = 4.01YY141 pKa = 10.4IADD144 pKa = 4.02DD145 pKa = 3.23NHH147 pKa = 7.1RR148 pKa = 11.84RR149 pKa = 11.84FQVKK153 pKa = 9.89KK154 pKa = 10.43FGILYY159 pKa = 9.9LEE161 pKa = 4.71SGGADD166 pKa = 3.12YY167 pKa = 11.26SVNTGKK173 pKa = 8.21QTYY176 pKa = 9.23NVQDD180 pKa = 3.25ALKK183 pKa = 10.28RR184 pKa = 11.84VFVKK188 pKa = 10.74CNTRR192 pKa = 11.84GVYY195 pKa = 10.13DD196 pKa = 4.0SNSSAGSISAMNSGALYY213 pKa = 9.88FVVNPTFAGYY223 pKa = 10.41LGFNITVYY231 pKa = 10.69HH232 pKa = 6.31NSPVV236 pKa = 3.07
MM1 pKa = 7.8AEE3 pKa = 4.57RR4 pKa = 11.84KK5 pKa = 9.63RR6 pKa = 11.84KK7 pKa = 9.13MEE9 pKa = 3.6WSKK12 pKa = 11.78ANRR15 pKa = 11.84KK16 pKa = 9.07RR17 pKa = 11.84SRR19 pKa = 11.84TTLPRR24 pKa = 11.84NSRR27 pKa = 11.84VYY29 pKa = 10.38ARR31 pKa = 11.84KK32 pKa = 9.65RR33 pKa = 11.84PILRR37 pKa = 11.84GPKK40 pKa = 8.52LTSRR44 pKa = 11.84DD45 pKa = 3.19KK46 pKa = 10.68VYY48 pKa = 10.43TYY50 pKa = 10.13TKK52 pKa = 10.91YY53 pKa = 8.87EE54 pKa = 4.09TLTTAGAVYY63 pKa = 10.11HH64 pKa = 6.49LNSFSQGLANNQRR77 pKa = 11.84ATSVDD82 pKa = 2.79IVHH85 pKa = 6.43NVQLRR90 pKa = 11.84FSVEE94 pKa = 4.03LPTGAMVFCRR104 pKa = 11.84RR105 pKa = 11.84YY106 pKa = 8.56KK107 pKa = 9.93MSWAVVQDD115 pKa = 3.63MMPGDD120 pKa = 4.23SMPAVSDD127 pKa = 3.54IFSMTSPPIEE137 pKa = 4.14GLEE140 pKa = 4.01YY141 pKa = 10.4IADD144 pKa = 4.02DD145 pKa = 3.23NHH147 pKa = 7.1RR148 pKa = 11.84RR149 pKa = 11.84FQVKK153 pKa = 9.89KK154 pKa = 10.43FGILYY159 pKa = 9.9LEE161 pKa = 4.71SGGADD166 pKa = 3.12YY167 pKa = 11.26SVNTGKK173 pKa = 8.21QTYY176 pKa = 9.23NVQDD180 pKa = 3.25ALKK183 pKa = 10.28RR184 pKa = 11.84VFVKK188 pKa = 10.74CNTRR192 pKa = 11.84GVYY195 pKa = 10.13DD196 pKa = 4.0SNSSAGSISAMNSGALYY213 pKa = 9.88FVVNPTFAGYY223 pKa = 10.41LGFNITVYY231 pKa = 10.69HH232 pKa = 6.31NSPVV236 pKa = 3.07
Molecular weight: 26.65 kDa
Isoelectric point according different methods:
Peptides (in silico digests for buttom-up proteomics)
Below you can find in silico digests of the whole proteome with Trypsin, Chymotrypsin, Trypsin+LysC, LysN, ArgC proteases suitable for different mass spec machines.| Try ESI |
 |
|---|
| ChTry ESI |
 |
|---|
| ArgC ESI |
 |
|---|
| LysN ESI |
 |
|---|
| TryLysC ESI |
 |
|---|
| Try MALDI |
 |
|---|
| ChTry MALDI |
 |
|---|
| ArgC MALDI |
 |
|---|
| LysN MALDI |
 |
|---|
| TryLysC MALDI |
 |
|---|
| Try LTQ |
 |
|---|
| ChTry LTQ |
 |
|---|
| ArgC LTQ |
 |
|---|
| LysN LTQ |
 |
|---|
| TryLysC LTQ |
 |
|---|
| Try MSlow |
 |
|---|
| ChTry MSlow |
 |
|---|
| ArgC MSlow |
 |
|---|
| LysN MSlow |
 |
|---|
| TryLysC MSlow |
 |
|---|
| Try MShigh |
 |
|---|
| ChTry MShigh |
 |
|---|
| ArgC MShigh |
 |
|---|
| LysN MShigh |
 |
|---|
| TryLysC MShigh |
 |
|---|
General Statistics
Number of major isoforms |
Number of additional isoforms |
Number of all proteins |
Number of amino acids |
Min. Seq. Length |
Max. Seq. Length |
Avg. Seq. Length |
Avg. Mol. Weight |
|---|---|---|---|---|---|---|---|
0 |
971 |
55 |
332 |
194.2 |
22.53 |
Amino acid frequency
Ala |
Cys |
Asp |
Glu |
Phe |
Gly |
His |
Ile |
Lys |
Leu |
|---|---|---|---|---|---|---|---|---|---|
5.252 ± 0.556 | 1.751 ± 0.36 |
5.252 ± 0.849 | 5.149 ± 0.677 |
4.943 ± 0.4 | 4.737 ± 0.657 |
1.648 ± 0.39 | 6.694 ± 0.891 |
5.149 ± 0.968 | 6.385 ± 0.839 |
Met |
Asn |
Gln |
Pro |
Arg |
Ser |
Thr |
Val |
Trp |
Tyr |
|---|---|---|---|---|---|---|---|---|---|
1.648 ± 0.571 | 6.076 ± 0.155 |
6.076 ± 0.948 | 5.561 ± 0.907 |
6.9 ± 0.938 | 7.518 ± 0.959 |
6.076 ± 0.518 | 5.458 ± 1.733 |
1.854 ± 0.373 | 5.87 ± 0.458 |
Most of the basic statistics you can see at this page can be downloaded from this CSV file
Proteome-pI is available under Creative Commons Attribution-NoDerivs license, for more details see here
| Reference: Kozlowski LP. Proteome-pI 2.0: Proteome Isoelectric Point Database Update. Nucleic Acids Res. 2021, doi: 10.1093/nar/gkab944 | Contact: Lukasz P. Kozlowski |
