Anaeromassilibacillus sp. An200
Taxonomy: cellular organisms; Bacteria; Terrabacteria group; Firmicutes; Clostridia; Eubacteriales; Oscillospiraceae; Anaeromassilibacillus; unclassified Anaeromassilibacillus
Average proteome isoelectric point is 6.12
Get precalculated fractions of proteins

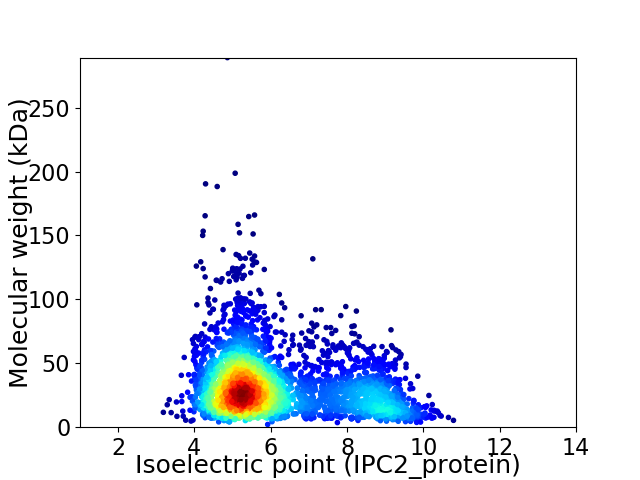
Virtual 2D-PAGE plot for 3479 proteins (isoelectric point calculated using IPC2_protein)
Get csv file with sequences according to given criteria:
* You can choose from 21 different methods for calculating isoelectric point
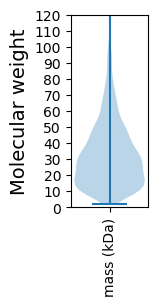
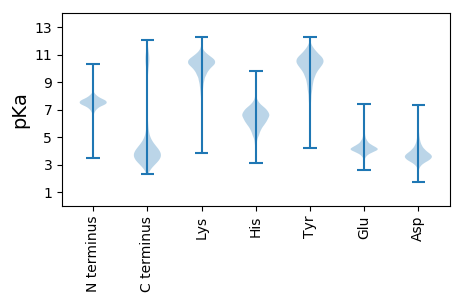
Summary statistics related to proteome-wise predictions


Protein with the lowest isoelectric point:
>tr|A0A1Y4HJH9|A0A1Y4HJH9_9FIRM ABC transmembrane type-1 domain-containing protein OS=Anaeromassilibacillus sp. An200 OX=1965587 GN=B5F35_13655 PE=3 SV=1
MM1 pKa = 7.88EE2 pKa = 6.17DD3 pKa = 3.37FVSCVTLADD12 pKa = 3.82GSRR15 pKa = 11.84IVLDD19 pKa = 4.83DD20 pKa = 3.99EE21 pKa = 6.03DD22 pKa = 4.7NVLLSLLSHH31 pKa = 6.59NGVEE35 pKa = 4.26DD36 pKa = 3.7TLQFSHH42 pKa = 7.43LSGNYY47 pKa = 9.96GGGSLLLSPSQKK59 pKa = 10.78YY60 pKa = 10.79LIFSYY65 pKa = 10.72FSGEE69 pKa = 4.18SEE71 pKa = 4.03EE72 pKa = 5.21GFALLEE78 pKa = 4.03IANNRR83 pKa = 11.84LKK85 pKa = 10.94LLYY88 pKa = 10.61DD89 pKa = 3.19SDD91 pKa = 4.07YY92 pKa = 11.38LYY94 pKa = 11.46GEE96 pKa = 4.53DD97 pKa = 4.44ANYY100 pKa = 11.01SFTNNEE106 pKa = 3.98TIIIQTFRR114 pKa = 11.84TGAWYY119 pKa = 10.26QDD121 pKa = 3.5DD122 pKa = 4.29ASIDD126 pKa = 3.93EE127 pKa = 4.77NGDD130 pKa = 3.04MYY132 pKa = 11.73YY133 pKa = 10.69EE134 pKa = 4.18FGEE137 pKa = 4.36LNLLNLEE144 pKa = 4.34TYY146 pKa = 10.9DD147 pKa = 4.57LDD149 pKa = 3.42RR150 pKa = 11.84HH151 pKa = 6.15TILVYY156 pKa = 10.15PSADD160 pKa = 2.88WKK162 pKa = 11.23EE163 pKa = 4.11EE164 pKa = 3.88EE165 pKa = 4.14TDD167 pKa = 3.05AGTFLFSDD175 pKa = 3.93ITSGMLKK182 pKa = 9.44IEE184 pKa = 4.37MPWGSEE190 pKa = 3.91SFPFPLQEE198 pKa = 3.88TLIVKK203 pKa = 9.02FNKK206 pKa = 10.02
MM1 pKa = 7.88EE2 pKa = 6.17DD3 pKa = 3.37FVSCVTLADD12 pKa = 3.82GSRR15 pKa = 11.84IVLDD19 pKa = 4.83DD20 pKa = 3.99EE21 pKa = 6.03DD22 pKa = 4.7NVLLSLLSHH31 pKa = 6.59NGVEE35 pKa = 4.26DD36 pKa = 3.7TLQFSHH42 pKa = 7.43LSGNYY47 pKa = 9.96GGGSLLLSPSQKK59 pKa = 10.78YY60 pKa = 10.79LIFSYY65 pKa = 10.72FSGEE69 pKa = 4.18SEE71 pKa = 4.03EE72 pKa = 5.21GFALLEE78 pKa = 4.03IANNRR83 pKa = 11.84LKK85 pKa = 10.94LLYY88 pKa = 10.61DD89 pKa = 3.19SDD91 pKa = 4.07YY92 pKa = 11.38LYY94 pKa = 11.46GEE96 pKa = 4.53DD97 pKa = 4.44ANYY100 pKa = 11.01SFTNNEE106 pKa = 3.98TIIIQTFRR114 pKa = 11.84TGAWYY119 pKa = 10.26QDD121 pKa = 3.5DD122 pKa = 4.29ASIDD126 pKa = 3.93EE127 pKa = 4.77NGDD130 pKa = 3.04MYY132 pKa = 11.73YY133 pKa = 10.69EE134 pKa = 4.18FGEE137 pKa = 4.36LNLLNLEE144 pKa = 4.34TYY146 pKa = 10.9DD147 pKa = 4.57LDD149 pKa = 3.42RR150 pKa = 11.84HH151 pKa = 6.15TILVYY156 pKa = 10.15PSADD160 pKa = 2.88WKK162 pKa = 11.23EE163 pKa = 4.11EE164 pKa = 3.88EE165 pKa = 4.14TDD167 pKa = 3.05AGTFLFSDD175 pKa = 3.93ITSGMLKK182 pKa = 9.44IEE184 pKa = 4.37MPWGSEE190 pKa = 3.91SFPFPLQEE198 pKa = 3.88TLIVKK203 pKa = 9.02FNKK206 pKa = 10.02
Molecular weight: 23.39 kDa
Isoelectric point according different methods:
Protein with the highest isoelectric point:
>tr|A0A1Y4HMA5|A0A1Y4HMA5_9FIRM Uncharacterized protein OS=Anaeromassilibacillus sp. An200 OX=1965587 GN=B5F35_16665 PE=4 SV=1
MM1 pKa = 7.27RR2 pKa = 11.84QWEE5 pKa = 4.44KK6 pKa = 10.36CGKK9 pKa = 4.56WTRR12 pKa = 11.84AAIIGSLCGLLNGLFGAGGGMAAVPLLRR40 pKa = 11.84AGGLEE45 pKa = 3.93QKK47 pKa = 9.93KK48 pKa = 9.57AHH50 pKa = 5.81ATSLAVILPLAAVSAVSYY68 pKa = 10.87LMAEE72 pKa = 4.09AVSFSQAAPYY82 pKa = 10.42LPGGFVGACAGALLMNRR99 pKa = 11.84IPSGMLRR106 pKa = 11.84RR107 pKa = 11.84VFGGLLIFAGVRR119 pKa = 11.84LLLRR123 pKa = 4.29
MM1 pKa = 7.27RR2 pKa = 11.84QWEE5 pKa = 4.44KK6 pKa = 10.36CGKK9 pKa = 4.56WTRR12 pKa = 11.84AAIIGSLCGLLNGLFGAGGGMAAVPLLRR40 pKa = 11.84AGGLEE45 pKa = 3.93QKK47 pKa = 9.93KK48 pKa = 9.57AHH50 pKa = 5.81ATSLAVILPLAAVSAVSYY68 pKa = 10.87LMAEE72 pKa = 4.09AVSFSQAAPYY82 pKa = 10.42LPGGFVGACAGALLMNRR99 pKa = 11.84IPSGMLRR106 pKa = 11.84RR107 pKa = 11.84VFGGLLIFAGVRR119 pKa = 11.84LLLRR123 pKa = 4.29
Molecular weight: 12.69 kDa
Isoelectric point according different methods:
Peptides (in silico digests for buttom-up proteomics)
Below you can find in silico digests of the whole proteome with Trypsin, Chymotrypsin, Trypsin+LysC, LysN, ArgC proteases suitable for different mass spec machines.| Try ESI |
 |
|---|
| ChTry ESI |
 |
|---|
| ArgC ESI |
 |
|---|
| LysN ESI |
 |
|---|
| TryLysC ESI |
 |
|---|
| Try MALDI |
 |
|---|
| ChTry MALDI |
 |
|---|
| ArgC MALDI |
 |
|---|
| LysN MALDI |
 |
|---|
| TryLysC MALDI |
 |
|---|
| Try LTQ |
 |
|---|
| ChTry LTQ |
 |
|---|
| ArgC LTQ |
 |
|---|
| LysN LTQ |
 |
|---|
| TryLysC LTQ |
 |
|---|
| Try MSlow |
 |
|---|
| ChTry MSlow |
 |
|---|
| ArgC MSlow |
 |
|---|
| LysN MSlow |
 |
|---|
| TryLysC MSlow |
 |
|---|
| Try MShigh |
 |
|---|
| ChTry MShigh |
 |
|---|
| ArgC MShigh |
 |
|---|
| LysN MShigh |
 |
|---|
| TryLysC MShigh |
 |
|---|
General Statistics
Number of major isoforms |
Number of additional isoforms |
Number of all proteins |
Number of amino acids |
Min. Seq. Length |
Max. Seq. Length |
Avg. Seq. Length |
Avg. Mol. Weight |
|---|---|---|---|---|---|---|---|
0 |
1072320 |
23 |
2544 |
308.2 |
34.3 |
Amino acid frequency
Ala |
Cys |
Asp |
Glu |
Phe |
Gly |
His |
Ile |
Lys |
Leu |
|---|---|---|---|---|---|---|---|---|---|
8.909 ± 0.049 | 1.704 ± 0.02 |
5.345 ± 0.036 | 7.398 ± 0.04 |
4.083 ± 0.032 | 7.417 ± 0.041 |
1.875 ± 0.019 | 5.65 ± 0.044 |
4.881 ± 0.035 | 9.896 ± 0.053 |
Met |
Asn |
Gln |
Pro |
Arg |
Ser |
Thr |
Val |
Trp |
Tyr |
|---|---|---|---|---|---|---|---|---|---|
2.695 ± 0.02 | 3.446 ± 0.029 |
4.267 ± 0.027 | 3.689 ± 0.028 |
5.886 ± 0.045 | 6.123 ± 0.035 |
5.344 ± 0.035 | 6.752 ± 0.033 |
1.103 ± 0.019 | 3.536 ± 0.028 |
Most of the basic statistics you can see at this page can be downloaded from this CSV file
Proteome-pI is available under Creative Commons Attribution-NoDerivs license, for more details see here
| Reference: Kozlowski LP. Proteome-pI 2.0: Proteome Isoelectric Point Database Update. Nucleic Acids Res. 2021, doi: 10.1093/nar/gkab944 | Contact: Lukasz P. Kozlowski |
