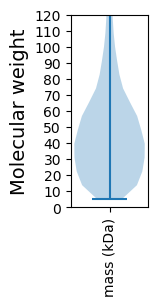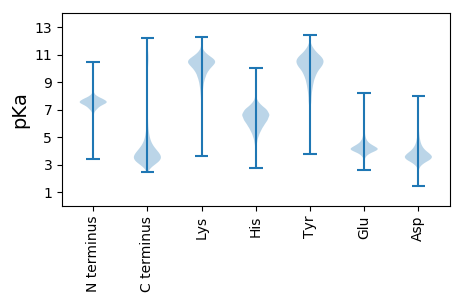
Aspergillus uvarum CBS 121591
Taxonomy: cellular organisms; Eukaryota; Opisthokonta; Fungi; Dikarya; Ascomycota; saccharomyceta; Pezizomycotina; leotiomyceta; Eurotiomycetes; Eurotiomycetidae; Eurotiales; Aspergillaceae; Aspergillus; Aspergillus uvarum
Average proteome isoelectric point is 6.48
Get precalculated fractions of proteins

Virtual 2D-PAGE plot for 12014 proteins (isoelectric point calculated using IPC2_protein)
Get csv file with sequences according to given criteria:
* You can choose from 21 different methods for calculating isoelectric point
Summary statistics related to proteome-wise predictions


Protein with the lowest isoelectric point:
>tr|A0A319CKJ5|A0A319CKJ5_9EURO Uncharacterized protein OS=Aspergillus uvarum CBS 121591 OX=1448315 GN=BO82DRAFT_300919 PE=4 SV=1
MM1 pKa = 7.85HH2 pKa = 7.35SFQLLGLAAVGSVVSAAPTASRR24 pKa = 11.84VSDD27 pKa = 3.71LVKK30 pKa = 10.58KK31 pKa = 10.77SSSTCTFTSASEE43 pKa = 3.88ASEE46 pKa = 4.57SISSCSNVVLSNIEE60 pKa = 3.99VPAGEE65 pKa = 4.33TLDD68 pKa = 5.08LSDD71 pKa = 4.59AADD74 pKa = 3.83GATITFEE81 pKa = 4.09GTTSFGYY88 pKa = 9.98EE89 pKa = 3.81EE90 pKa = 4.45WDD92 pKa = 3.63GPLIRR97 pKa = 11.84FGGKK101 pKa = 8.74QLTITQSDD109 pKa = 4.43GAVIDD114 pKa = 4.31GDD116 pKa = 4.05GSRR119 pKa = 11.84WWDD122 pKa = 3.35SEE124 pKa = 3.76GTNGGKK130 pKa = 8.21TKK132 pKa = 10.35PKK134 pKa = 9.92FMYY137 pKa = 10.07VHH139 pKa = 7.06DD140 pKa = 4.85VEE142 pKa = 6.36DD143 pKa = 3.77STIKK147 pKa = 10.66GLQIKK152 pKa = 7.5NTPVQAISVQATNVYY167 pKa = 8.84LTDD170 pKa = 3.36ITIDD174 pKa = 3.67NSDD177 pKa = 3.3GDD179 pKa = 4.6DD180 pKa = 3.68NGGHH184 pKa = 5.52NTDD187 pKa = 4.04GFDD190 pKa = 3.2ISEE193 pKa = 4.27STGVYY198 pKa = 9.94ISGATVKK205 pKa = 10.87NQDD208 pKa = 3.2DD209 pKa = 4.45CIAINSGEE217 pKa = 4.27NILFTGGTCSGGHH230 pKa = 5.98GLSIGSVGGRR240 pKa = 11.84DD241 pKa = 3.68DD242 pKa = 3.79NTVKK246 pKa = 10.74NVTISDD252 pKa = 3.87STVTDD257 pKa = 3.23SANGVRR263 pKa = 11.84IKK265 pKa = 9.9TIYY268 pKa = 10.64GDD270 pKa = 3.53TGDD273 pKa = 3.8VSEE276 pKa = 4.45VTYY279 pKa = 11.42SNIQLSGITDD289 pKa = 3.43YY290 pKa = 11.75GIVIEE295 pKa = 4.22QDD297 pKa = 3.68YY298 pKa = 11.2EE299 pKa = 4.24NGSPTGTPSTGVPITDD315 pKa = 3.4VTVDD319 pKa = 4.86GITGSIEE326 pKa = 3.88DD327 pKa = 4.79DD328 pKa = 3.32AVQVYY333 pKa = 9.15ILCGDD338 pKa = 4.56GSCSDD343 pKa = 3.75WTWSGVDD350 pKa = 3.03ITGGEE355 pKa = 4.17TSSDD359 pKa = 3.92CEE361 pKa = 4.18NVPSGASCC369 pKa = 4.0
MM1 pKa = 7.85HH2 pKa = 7.35SFQLLGLAAVGSVVSAAPTASRR24 pKa = 11.84VSDD27 pKa = 3.71LVKK30 pKa = 10.58KK31 pKa = 10.77SSSTCTFTSASEE43 pKa = 3.88ASEE46 pKa = 4.57SISSCSNVVLSNIEE60 pKa = 3.99VPAGEE65 pKa = 4.33TLDD68 pKa = 5.08LSDD71 pKa = 4.59AADD74 pKa = 3.83GATITFEE81 pKa = 4.09GTTSFGYY88 pKa = 9.98EE89 pKa = 3.81EE90 pKa = 4.45WDD92 pKa = 3.63GPLIRR97 pKa = 11.84FGGKK101 pKa = 8.74QLTITQSDD109 pKa = 4.43GAVIDD114 pKa = 4.31GDD116 pKa = 4.05GSRR119 pKa = 11.84WWDD122 pKa = 3.35SEE124 pKa = 3.76GTNGGKK130 pKa = 8.21TKK132 pKa = 10.35PKK134 pKa = 9.92FMYY137 pKa = 10.07VHH139 pKa = 7.06DD140 pKa = 4.85VEE142 pKa = 6.36DD143 pKa = 3.77STIKK147 pKa = 10.66GLQIKK152 pKa = 7.5NTPVQAISVQATNVYY167 pKa = 8.84LTDD170 pKa = 3.36ITIDD174 pKa = 3.67NSDD177 pKa = 3.3GDD179 pKa = 4.6DD180 pKa = 3.68NGGHH184 pKa = 5.52NTDD187 pKa = 4.04GFDD190 pKa = 3.2ISEE193 pKa = 4.27STGVYY198 pKa = 9.94ISGATVKK205 pKa = 10.87NQDD208 pKa = 3.2DD209 pKa = 4.45CIAINSGEE217 pKa = 4.27NILFTGGTCSGGHH230 pKa = 5.98GLSIGSVGGRR240 pKa = 11.84DD241 pKa = 3.68DD242 pKa = 3.79NTVKK246 pKa = 10.74NVTISDD252 pKa = 3.87STVTDD257 pKa = 3.23SANGVRR263 pKa = 11.84IKK265 pKa = 9.9TIYY268 pKa = 10.64GDD270 pKa = 3.53TGDD273 pKa = 3.8VSEE276 pKa = 4.45VTYY279 pKa = 11.42SNIQLSGITDD289 pKa = 3.43YY290 pKa = 11.75GIVIEE295 pKa = 4.22QDD297 pKa = 3.68YY298 pKa = 11.2EE299 pKa = 4.24NGSPTGTPSTGVPITDD315 pKa = 3.4VTVDD319 pKa = 4.86GITGSIEE326 pKa = 3.88DD327 pKa = 4.79DD328 pKa = 3.32AVQVYY333 pKa = 9.15ILCGDD338 pKa = 4.56GSCSDD343 pKa = 3.75WTWSGVDD350 pKa = 3.03ITGGEE355 pKa = 4.17TSSDD359 pKa = 3.92CEE361 pKa = 4.18NVPSGASCC369 pKa = 4.0
Molecular weight: 38.08 kDa
Isoelectric point according different methods:
Protein with the highest isoelectric point:
>tr|A0A319CWA2|A0A319CWA2_9EURO Uncharacterized protein OS=Aspergillus uvarum CBS 121591 OX=1448315 GN=BO82DRAFT_397350 PE=4 SV=1
MM1 pKa = 7.88PSHH4 pKa = 6.91KK5 pKa = 10.39SFRR8 pKa = 11.84TKK10 pKa = 10.45QKK12 pKa = 9.84LAKK15 pKa = 9.55AQKK18 pKa = 8.59QNRR21 pKa = 11.84PIPQWIRR28 pKa = 11.84LRR30 pKa = 11.84TGNTIRR36 pKa = 11.84YY37 pKa = 5.79NAKK40 pKa = 8.89RR41 pKa = 11.84RR42 pKa = 11.84HH43 pKa = 4.14WRR45 pKa = 11.84KK46 pKa = 7.41TRR48 pKa = 11.84LGII51 pKa = 4.46
MM1 pKa = 7.88PSHH4 pKa = 6.91KK5 pKa = 10.39SFRR8 pKa = 11.84TKK10 pKa = 10.45QKK12 pKa = 9.84LAKK15 pKa = 9.55AQKK18 pKa = 8.59QNRR21 pKa = 11.84PIPQWIRR28 pKa = 11.84LRR30 pKa = 11.84TGNTIRR36 pKa = 11.84YY37 pKa = 5.79NAKK40 pKa = 8.89RR41 pKa = 11.84RR42 pKa = 11.84HH43 pKa = 4.14WRR45 pKa = 11.84KK46 pKa = 7.41TRR48 pKa = 11.84LGII51 pKa = 4.46
Molecular weight: 6.25 kDa
Isoelectric point according different methods:
Peptides (in silico digests for buttom-up proteomics)
Below you can find in silico digests of the whole proteome with Trypsin, Chymotrypsin, Trypsin+LysC, LysN, ArgC proteases suitable for different mass spec machines.| Try ESI |
 |
|---|
| ChTry ESI |
 |
|---|
| ArgC ESI |
 |
|---|
| LysN ESI |
 |
|---|
| TryLysC ESI |
 |
|---|
| Try MALDI |
 |
|---|
| ChTry MALDI |
 |
|---|
| ArgC MALDI |
 |
|---|
| LysN MALDI |
 |
|---|
| TryLysC MALDI |
 |
|---|
| Try LTQ |
 |
|---|
| ChTry LTQ |
 |
|---|
| ArgC LTQ |
 |
|---|
| LysN LTQ |
 |
|---|
| TryLysC LTQ |
 |
|---|
| Try MSlow |
 |
|---|
| ChTry MSlow |
 |
|---|
| ArgC MSlow |
 |
|---|
| LysN MSlow |
 |
|---|
| TryLysC MSlow |
 |
|---|
| Try MShigh |
 |
|---|
| ChTry MShigh |
 |
|---|
| ArgC MShigh |
 |
|---|
| LysN MShigh |
 |
|---|
| TryLysC MShigh |
 |
|---|
General Statistics
Number of major isoforms |
Number of additional isoforms |
Number of all proteins |
Number of amino acids |
Min. Seq. Length |
Max. Seq. Length |
Avg. Seq. Length |
Avg. Mol. Weight |
|---|---|---|---|---|---|---|---|
0 |
5616582 |
49 |
7777 |
467.5 |
51.69 |
Amino acid frequency
Ala |
Cys |
Asp |
Glu |
Phe |
Gly |
His |
Ile |
Lys |
Leu |
|---|---|---|---|---|---|---|---|---|---|
8.921 ± 0.018 | 1.331 ± 0.009 |
5.49 ± 0.017 | 6.001 ± 0.019 |
3.712 ± 0.013 | 6.819 ± 0.02 |
2.54 ± 0.01 | 4.785 ± 0.014 |
4.158 ± 0.019 | 9.311 ± 0.023 |
Met |
Asn |
Gln |
Pro |
Arg |
Ser |
Thr |
Val |
Trp |
Tyr |
|---|---|---|---|---|---|---|---|---|---|
2.098 ± 0.009 | 3.402 ± 0.011 |
6.072 ± 0.026 | 4.114 ± 0.013 |
6.271 ± 0.018 | 8.171 ± 0.028 |
6.144 ± 0.018 | 6.297 ± 0.017 |
1.514 ± 0.009 | 2.849 ± 0.013 |
Most of the basic statistics you can see at this page can be downloaded from this CSV file
Proteome-pI is available under Creative Commons Attribution-NoDerivs license, for more details see here
| Reference: Kozlowski LP. Proteome-pI 2.0: Proteome Isoelectric Point Database Update. Nucleic Acids Res. 2021, doi: 10.1093/nar/gkab944 | Contact: Lukasz P. Kozlowski |
