Pseudoxanthomonas indica
Taxonomy: cellular organisms; Bacteria; Proteobacteria; Gammaproteobacteria; Xanthomonadales; Xanthomonadaceae; Pseudoxanthomonas
Average proteome isoelectric point is 6.58
Get precalculated fractions of proteins

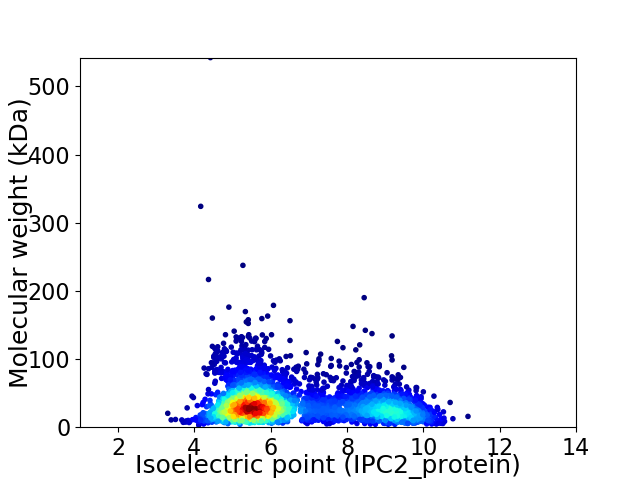
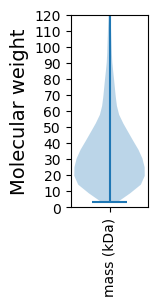
Virtual 2D-PAGE plot for 3555 proteins (isoelectric point calculated using IPC2_protein)
Get csv file with sequences according to given criteria:
* You can choose from 21 different methods for calculating isoelectric point
Summary statistics related to proteome-wise predictions


Protein with the lowest isoelectric point:
>tr|A0A1T5LPR8|A0A1T5LPR8_9GAMM DUF418 domain-containing protein OS=Pseudoxanthomonas indica OX=428993 GN=SAMN06296058_2879 PE=4 SV=1
MM1 pKa = 7.45KK2 pKa = 9.78PVKK5 pKa = 10.37LSRR8 pKa = 11.84ALTAALLLAVPFVSYY23 pKa = 10.34AQEE26 pKa = 3.74AAEE29 pKa = 4.39PEE31 pKa = 4.5EE32 pKa = 4.41ASSPVTWSIAATTDD46 pKa = 3.25YY47 pKa = 11.1VFRR50 pKa = 11.84GVSQTDD56 pKa = 3.25EE57 pKa = 4.69GPALQAGLTYY67 pKa = 8.9TAPFGLYY74 pKa = 9.45VGAWGSNVDD83 pKa = 5.32FGDD86 pKa = 4.44PDD88 pKa = 3.6PEE90 pKa = 5.75AGVRR94 pKa = 11.84GVDD97 pKa = 3.41TEE99 pKa = 4.48LDD101 pKa = 3.65LFVGYY106 pKa = 10.33SHH108 pKa = 7.95DD109 pKa = 6.39FNDD112 pKa = 3.19SWNLDD117 pKa = 3.58VSALRR122 pKa = 11.84YY123 pKa = 7.19TYY125 pKa = 10.34HH126 pKa = 6.67GASDD130 pKa = 4.21GVDD133 pKa = 2.88SGDD136 pKa = 3.45YY137 pKa = 9.36MEE139 pKa = 5.85YY140 pKa = 9.47IAKK143 pKa = 7.97VTWAGPVEE151 pKa = 4.42VSGLVAYY158 pKa = 10.29APDD161 pKa = 4.05YY162 pKa = 11.78GDD164 pKa = 3.96LTPKK168 pKa = 10.6AKK170 pKa = 10.23EE171 pKa = 4.0SYY173 pKa = 10.69ANLSASYY180 pKa = 10.28EE181 pKa = 4.18FGDD184 pKa = 4.15SGISLGAGVGYY195 pKa = 9.29TSVDD199 pKa = 3.51YY200 pKa = 10.81GAEE203 pKa = 4.2TIDD206 pKa = 4.75GEE208 pKa = 4.29RR209 pKa = 11.84FDD211 pKa = 5.45YY212 pKa = 11.14GVTDD216 pKa = 3.88YY217 pKa = 11.4FDD219 pKa = 4.01GALTVSKK226 pKa = 10.97AFGPATATLGYY237 pKa = 8.22YY238 pKa = 7.15TTFASDD244 pKa = 3.62ADD246 pKa = 4.15LLKK249 pKa = 10.94DD250 pKa = 3.43EE251 pKa = 4.97SGIYY255 pKa = 9.77DD256 pKa = 3.82DD257 pKa = 6.32RR258 pKa = 11.84IALTISIGNN267 pKa = 3.66
MM1 pKa = 7.45KK2 pKa = 9.78PVKK5 pKa = 10.37LSRR8 pKa = 11.84ALTAALLLAVPFVSYY23 pKa = 10.34AQEE26 pKa = 3.74AAEE29 pKa = 4.39PEE31 pKa = 4.5EE32 pKa = 4.41ASSPVTWSIAATTDD46 pKa = 3.25YY47 pKa = 11.1VFRR50 pKa = 11.84GVSQTDD56 pKa = 3.25EE57 pKa = 4.69GPALQAGLTYY67 pKa = 8.9TAPFGLYY74 pKa = 9.45VGAWGSNVDD83 pKa = 5.32FGDD86 pKa = 4.44PDD88 pKa = 3.6PEE90 pKa = 5.75AGVRR94 pKa = 11.84GVDD97 pKa = 3.41TEE99 pKa = 4.48LDD101 pKa = 3.65LFVGYY106 pKa = 10.33SHH108 pKa = 7.95DD109 pKa = 6.39FNDD112 pKa = 3.19SWNLDD117 pKa = 3.58VSALRR122 pKa = 11.84YY123 pKa = 7.19TYY125 pKa = 10.34HH126 pKa = 6.67GASDD130 pKa = 4.21GVDD133 pKa = 2.88SGDD136 pKa = 3.45YY137 pKa = 9.36MEE139 pKa = 5.85YY140 pKa = 9.47IAKK143 pKa = 7.97VTWAGPVEE151 pKa = 4.42VSGLVAYY158 pKa = 10.29APDD161 pKa = 4.05YY162 pKa = 11.78GDD164 pKa = 3.96LTPKK168 pKa = 10.6AKK170 pKa = 10.23EE171 pKa = 4.0SYY173 pKa = 10.69ANLSASYY180 pKa = 10.28EE181 pKa = 4.18FGDD184 pKa = 4.15SGISLGAGVGYY195 pKa = 9.29TSVDD199 pKa = 3.51YY200 pKa = 10.81GAEE203 pKa = 4.2TIDD206 pKa = 4.75GEE208 pKa = 4.29RR209 pKa = 11.84FDD211 pKa = 5.45YY212 pKa = 11.14GVTDD216 pKa = 3.88YY217 pKa = 11.4FDD219 pKa = 4.01GALTVSKK226 pKa = 10.97AFGPATATLGYY237 pKa = 8.22YY238 pKa = 7.15TTFASDD244 pKa = 3.62ADD246 pKa = 4.15LLKK249 pKa = 10.94DD250 pKa = 3.43EE251 pKa = 4.97SGIYY255 pKa = 9.77DD256 pKa = 3.82DD257 pKa = 6.32RR258 pKa = 11.84IALTISIGNN267 pKa = 3.66
Molecular weight: 28.32 kDa
Isoelectric point according different methods:
Protein with the highest isoelectric point:
>tr|A0A1T5LAN8|A0A1T5LAN8_9GAMM Membrane-bound lytic murein transglycosylase B OS=Pseudoxanthomonas indica OX=428993 GN=SAMN06296058_2206 PE=4 SV=1
MM1 pKa = 7.25LTLASQFDD9 pKa = 4.16SRR11 pKa = 11.84HH12 pKa = 5.58APLLPLDD19 pKa = 3.2RR20 pKa = 11.84WLRR23 pKa = 11.84RR24 pKa = 11.84MVVCGLLIVLLFPLGRR40 pKa = 11.84GQIPWLGWAPLWLVGMPLAAWWALHH65 pKa = 6.45RR66 pKa = 11.84FRR68 pKa = 11.84LPWPRR73 pKa = 11.84RR74 pKa = 11.84GAWTGRR80 pKa = 11.84RR81 pKa = 11.84RR82 pKa = 11.84RR83 pKa = 11.84RR84 pKa = 11.84LGGQARR90 pKa = 11.84RR91 pKa = 11.84RR92 pKa = 11.84APMPAHH98 pKa = 6.59WASHH102 pKa = 5.58GARR105 pKa = 11.84ATT107 pKa = 3.44
MM1 pKa = 7.25LTLASQFDD9 pKa = 4.16SRR11 pKa = 11.84HH12 pKa = 5.58APLLPLDD19 pKa = 3.2RR20 pKa = 11.84WLRR23 pKa = 11.84RR24 pKa = 11.84MVVCGLLIVLLFPLGRR40 pKa = 11.84GQIPWLGWAPLWLVGMPLAAWWALHH65 pKa = 6.45RR66 pKa = 11.84FRR68 pKa = 11.84LPWPRR73 pKa = 11.84RR74 pKa = 11.84GAWTGRR80 pKa = 11.84RR81 pKa = 11.84RR82 pKa = 11.84RR83 pKa = 11.84RR84 pKa = 11.84LGGQARR90 pKa = 11.84RR91 pKa = 11.84RR92 pKa = 11.84APMPAHH98 pKa = 6.59WASHH102 pKa = 5.58GARR105 pKa = 11.84ATT107 pKa = 3.44
Molecular weight: 12.43 kDa
Isoelectric point according different methods:
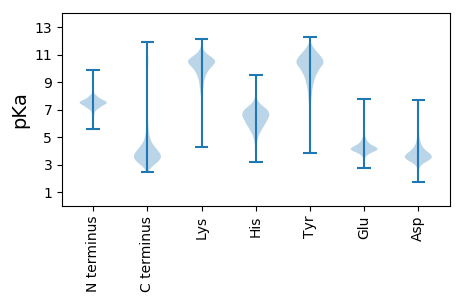
Peptides (in silico digests for buttom-up proteomics)
Below you can find in silico digests of the whole proteome with Trypsin, Chymotrypsin, Trypsin+LysC, LysN, ArgC proteases suitable for different mass spec machines.| Try ESI |
 |
|---|
| ChTry ESI |
 |
|---|
| ArgC ESI |
 |
|---|
| LysN ESI |
 |
|---|
| TryLysC ESI |
 |
|---|
| Try MALDI |
 |
|---|
| ChTry MALDI |
 |
|---|
| ArgC MALDI |
 |
|---|
| LysN MALDI |
 |
|---|
| TryLysC MALDI |
 |
|---|
| Try LTQ |
 |
|---|
| ChTry LTQ |
 |
|---|
| ArgC LTQ |
 |
|---|
| LysN LTQ |
 |
|---|
| TryLysC LTQ |
 |
|---|
| Try MSlow |
 |
|---|
| ChTry MSlow |
 |
|---|
| ArgC MSlow |
 |
|---|
| LysN MSlow |
 |
|---|
| TryLysC MSlow |
 |
|---|
| Try MShigh |
 |
|---|
| ChTry MShigh |
 |
|---|
| ArgC MShigh |
 |
|---|
| LysN MShigh |
 |
|---|
| TryLysC MShigh |
 |
|---|
General Statistics
Number of major isoforms |
Number of additional isoforms |
Number of all proteins |
Number of amino acids |
Min. Seq. Length |
Max. Seq. Length |
Avg. Seq. Length |
Avg. Mol. Weight |
|---|---|---|---|---|---|---|---|
0 |
1197874 |
30 |
5474 |
337.0 |
36.69 |
Amino acid frequency
Ala |
Cys |
Asp |
Glu |
Phe |
Gly |
His |
Ile |
Lys |
Leu |
|---|---|---|---|---|---|---|---|---|---|
12.586 ± 0.061 | 0.78 ± 0.013 |
5.832 ± 0.03 | 5.328 ± 0.044 |
3.412 ± 0.024 | 8.469 ± 0.056 |
2.226 ± 0.02 | 4.195 ± 0.029 |
2.9 ± 0.037 | 10.741 ± 0.052 |
Met |
Asn |
Gln |
Pro |
Arg |
Ser |
Thr |
Val |
Trp |
Tyr |
|---|---|---|---|---|---|---|---|---|---|
2.147 ± 0.02 | 2.698 ± 0.031 |
5.205 ± 0.034 | 4.121 ± 0.023 |
7.377 ± 0.04 | 5.528 ± 0.035 |
5.014 ± 0.039 | 7.359 ± 0.035 |
1.635 ± 0.018 | 2.445 ± 0.025 |
Most of the basic statistics you can see at this page can be downloaded from this CSV file
Proteome-pI is available under Creative Commons Attribution-NoDerivs license, for more details see here
| Reference: Kozlowski LP. Proteome-pI 2.0: Proteome Isoelectric Point Database Update. Nucleic Acids Res. 2021, doi: 10.1093/nar/gkab944 | Contact: Lukasz P. Kozlowski |
