Streptomyces netropsis (Streptoverticillium netropsis)
Taxonomy: cellular organisms; Bacteria; Terrabacteria group; Actinobacteria; Actinomycetia; Streptomycetales; Streptomycetaceae; Streptomyces
Average proteome isoelectric point is 6.55
Get precalculated fractions of proteins
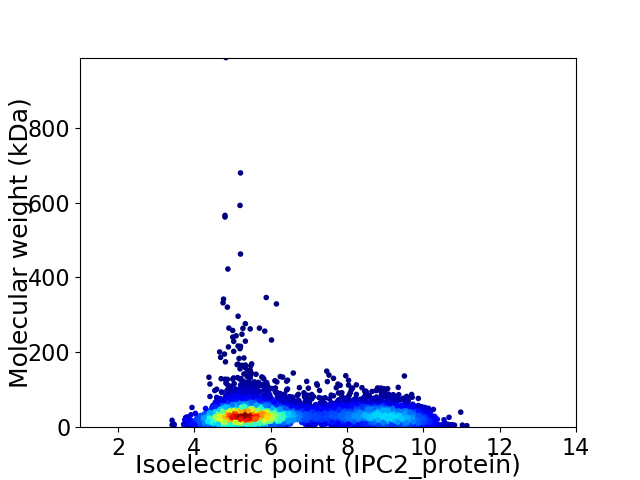
Virtual 2D-PAGE plot for 5796 proteins (isoelectric point calculated using IPC2_protein)
Get csv file with sequences according to given criteria:
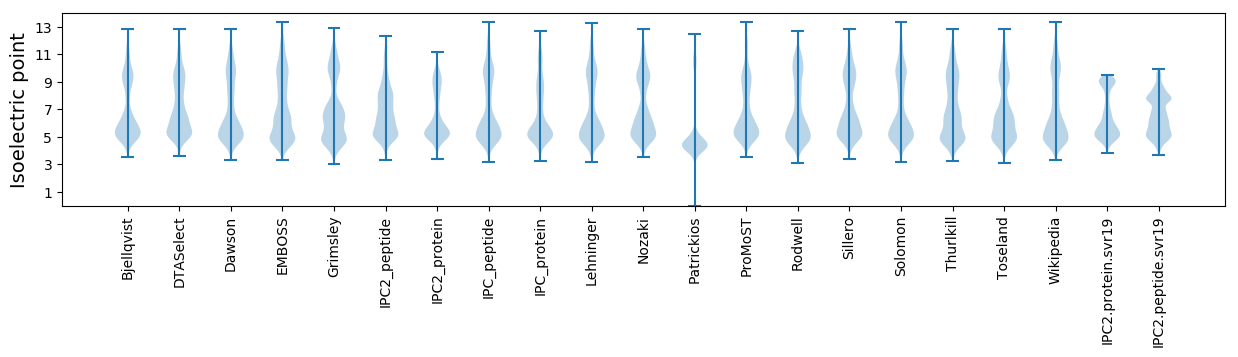
* You can choose from 21 different methods for calculating isoelectric point
Summary statistics related to proteome-wise predictions
Protein with the lowest isoelectric point:
>tr|A0A445N8I3|A0A445N8I3_STRNE Uncharacterized protein OS=Streptomyces netropsis OX=55404 GN=SNS2_1511 PE=4 SV=1
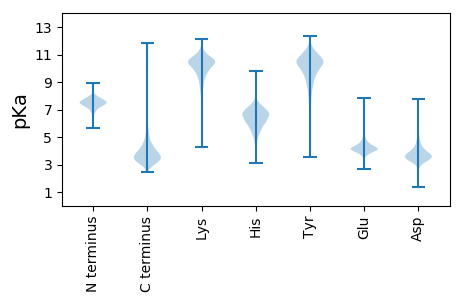
MM1 pKa = 7.39AASAQLLLSALSKK14 pKa = 10.29PVPSPCACAHH24 pKa = 7.09DD25 pKa = 5.15DD26 pKa = 4.2GYY28 pKa = 11.58LPEE31 pKa = 5.31FDD33 pKa = 4.71GPLPAGSGSGAPAEE47 pKa = 4.45PPLTSEE53 pKa = 4.91PPLADD58 pKa = 3.4ATPLTSEE65 pKa = 4.6PPLATEE71 pKa = 5.12LPLTSEE77 pKa = 4.21PTATVHH83 pKa = 6.59GPAFGTEE90 pKa = 3.92SSEE93 pKa = 4.12VV94 pKa = 3.32
MM1 pKa = 7.39AASAQLLLSALSKK14 pKa = 10.29PVPSPCACAHH24 pKa = 7.09DD25 pKa = 5.15DD26 pKa = 4.2GYY28 pKa = 11.58LPEE31 pKa = 5.31FDD33 pKa = 4.71GPLPAGSGSGAPAEE47 pKa = 4.45PPLTSEE53 pKa = 4.91PPLADD58 pKa = 3.4ATPLTSEE65 pKa = 4.6PPLATEE71 pKa = 5.12LPLTSEE77 pKa = 4.21PTATVHH83 pKa = 6.59GPAFGTEE90 pKa = 3.92SSEE93 pKa = 4.12VV94 pKa = 3.32
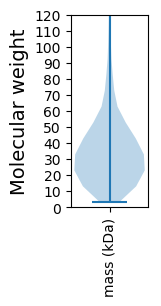
Molecular weight: 9.3 kDa
Isoelectric point according different methods:
Protein with the highest isoelectric point:
>tr|A0A445NBD2|A0A445NBD2_STRNE dCTP deaminase dUMP-forming OS=Streptomyces netropsis OX=55404 GN=dcd PE=3 SV=1
MM1 pKa = 7.4GSVIKK6 pKa = 10.42KK7 pKa = 8.47RR8 pKa = 11.84RR9 pKa = 11.84KK10 pKa = 9.22RR11 pKa = 11.84MAKK14 pKa = 9.41KK15 pKa = 9.99KK16 pKa = 9.72HH17 pKa = 5.74RR18 pKa = 11.84KK19 pKa = 7.77LLKK22 pKa = 8.07RR23 pKa = 11.84TRR25 pKa = 11.84VQRR28 pKa = 11.84RR29 pKa = 11.84NKK31 pKa = 9.81KK32 pKa = 9.63
MM1 pKa = 7.4GSVIKK6 pKa = 10.42KK7 pKa = 8.47RR8 pKa = 11.84RR9 pKa = 11.84KK10 pKa = 9.22RR11 pKa = 11.84MAKK14 pKa = 9.41KK15 pKa = 9.99KK16 pKa = 9.72HH17 pKa = 5.74RR18 pKa = 11.84KK19 pKa = 7.77LLKK22 pKa = 8.07RR23 pKa = 11.84TRR25 pKa = 11.84VQRR28 pKa = 11.84RR29 pKa = 11.84NKK31 pKa = 9.81KK32 pKa = 9.63
Molecular weight: 4.05 kDa
Isoelectric point according different methods:
Peptides (in silico digests for buttom-up proteomics)
Below you can find in silico digests of the whole proteome with Trypsin, Chymotrypsin, Trypsin+LysC, LysN, ArgC proteases suitable for different mass spec machines.| Try ESI |
 |
|---|
| ChTry ESI |
|
|---|
| ArgC ESI |
|
|---|
| LysN ESI |
|
|---|
| TryLysC ESI |
|
|---|
| Try MALDI |
|
|---|
| ChTry MALDI |
|
|---|
| ArgC MALDI |
|
|---|
| LysN MALDI |
|
|---|
| TryLysC MALDI |
|
|---|
| Try LTQ |
|
|---|
| ChTry LTQ |
|
|---|
| ArgC LTQ |
|
|---|
| LysN LTQ |
|
|---|
| TryLysC LTQ |
|
|---|
| Try MSlow |
|
|---|
| ChTry MSlow |
|
|---|
| ArgC MSlow |
|
|---|
| LysN MSlow |
|
|---|
| TryLysC MSlow |
|
|---|
| Try MShigh |
|
|---|
| ChTry MShigh |
|
|---|
| ArgC MShigh |
|
|---|
| LysN MShigh |
|
|---|
| TryLysC MShigh |
|
|---|
General Statistics
Number of major isoforms |
Number of additional isoforms |
Number of all proteins |
Number of amino acids |
Min. Seq. Length |
Max. Seq. Length |
Avg. Seq. Length |
Avg. Mol. Weight |
|---|---|---|---|---|---|---|---|
0 |
2018260 |
29 |
9458 |
348.2 |
37.2 |
Amino acid frequency
Ala |
Cys |
Asp |
Glu |
Phe |
Gly |
His |
Ile |
Lys |
Leu |
|---|---|---|---|---|---|---|---|---|---|
13.932 ± 0.052 | 0.819 ± 0.008 |
5.955 ± 0.027 | 5.678 ± 0.032 |
2.727 ± 0.018 | 9.616 ± 0.032 |
2.33 ± 0.014 | 3.068 ± 0.022 |
2.249 ± 0.032 | 10.295 ± 0.042 |
Met |
Asn |
Gln |
Pro |
Arg |
Ser |
Thr |
Val |
Trp |
Tyr |
|---|---|---|---|---|---|---|---|---|---|
1.734 ± 0.012 | 1.66 ± 0.017 |
6.333 ± 0.034 | 2.611 ± 0.019 |
8.212 ± 0.035 | 4.914 ± 0.023 |
6.034 ± 0.025 | 8.365 ± 0.029 |
1.468 ± 0.012 | 2.0 ± 0.015 |
Most of the basic statistics you can see at this page can be downloaded from this CSV file
See this proteome in:

Proteome-pI is available under Creative Commons Attribution-NoDerivs license, for more details see here
| Reference: Kozlowski LP. Proteome-pI 2.0: Proteome Isoelectric Point Database Update. Nucleic Acids Res. 2021, doi: 10.1093/nar/gkab944 | Contact: Lukasz P. Kozlowski |