Clostridium tarantellae
Taxonomy: cellular organisms; Bacteria; Terrabacteria group; Firmicutes; Clostridia; Eubacteriales; Clostridiaceae; Clostridium
Average proteome isoelectric point is 6.85
Get precalculated fractions of proteins
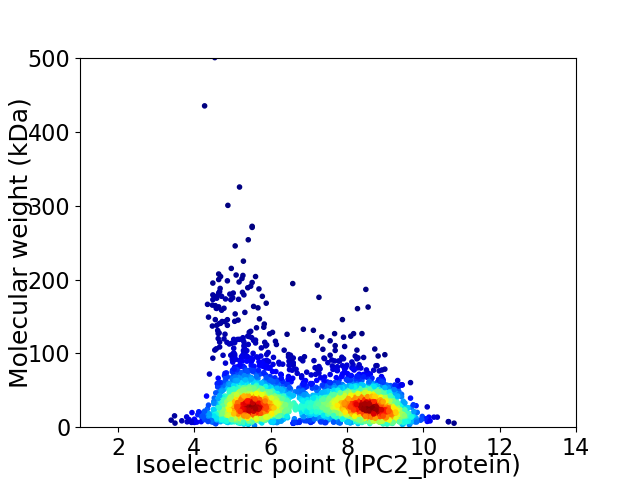
Virtual 2D-PAGE plot for 3225 proteins (isoelectric point calculated using IPC2_protein)
Get csv file with sequences according to given criteria:
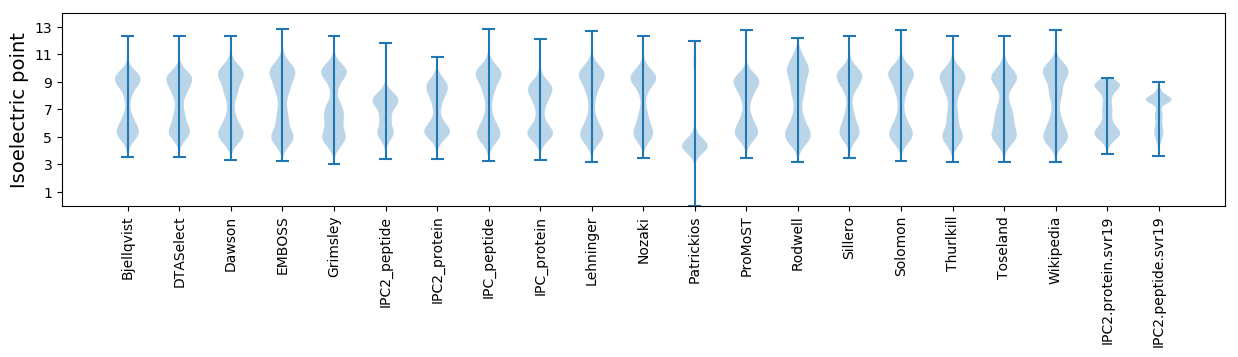
* You can choose from 21 different methods for calculating isoelectric point
Summary statistics related to proteome-wise predictions
Protein with the lowest isoelectric point:
>tr|A0A6I1MR54|A0A6I1MR54_9CLOT MarR family transcriptional regulator OS=Clostridium tarantellae OX=39493 GN=GBZ86_14555 PE=4 SV=1
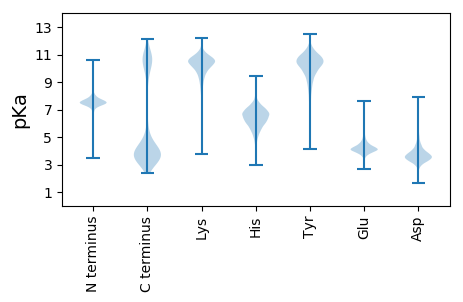
MM1 pKa = 7.29KK2 pKa = 10.47AVVDD6 pKa = 3.74KK7 pKa = 10.4DD8 pKa = 3.67LCIGCGLCEE17 pKa = 4.25STCPEE22 pKa = 4.1VFSIGDD28 pKa = 3.68DD29 pKa = 3.69GKK31 pKa = 10.92SQAISEE37 pKa = 5.0DD38 pKa = 3.26IPKK41 pKa = 10.19EE42 pKa = 3.96FEE44 pKa = 4.47DD45 pKa = 3.88NAVEE49 pKa = 4.6ASTNCPVGAITIEE62 pKa = 3.94
MM1 pKa = 7.29KK2 pKa = 10.47AVVDD6 pKa = 3.74KK7 pKa = 10.4DD8 pKa = 3.67LCIGCGLCEE17 pKa = 4.25STCPEE22 pKa = 4.1VFSIGDD28 pKa = 3.68DD29 pKa = 3.69GKK31 pKa = 10.92SQAISEE37 pKa = 5.0DD38 pKa = 3.26IPKK41 pKa = 10.19EE42 pKa = 3.96FEE44 pKa = 4.47DD45 pKa = 3.88NAVEE49 pKa = 4.6ASTNCPVGAITIEE62 pKa = 3.94
Molecular weight: 6.49 kDa
Isoelectric point according different methods:
Protein with the highest isoelectric point:
>tr|A0A6I1MID3|A0A6I1MID3_9CLOT Oxidoreductase OS=Clostridium tarantellae OX=39493 GN=GBZ86_02745 PE=4 SV=1
MM1 pKa = 7.53SRR3 pKa = 11.84RR4 pKa = 11.84CEE6 pKa = 3.79ICDD9 pKa = 3.31KK10 pKa = 11.1GVVSGKK16 pKa = 10.1QYY18 pKa = 10.63SHH20 pKa = 6.33SHH22 pKa = 5.27RR23 pKa = 11.84QSNRR27 pKa = 11.84TWAPNIKK34 pKa = 9.58KK35 pKa = 10.2VKK37 pKa = 10.08AIVKK41 pKa = 7.32GTPKK45 pKa = 9.67TVHH48 pKa = 4.9VCTRR52 pKa = 11.84CLRR55 pKa = 11.84SGKK58 pKa = 7.37VQRR61 pKa = 11.84AII63 pKa = 3.7
MM1 pKa = 7.53SRR3 pKa = 11.84RR4 pKa = 11.84CEE6 pKa = 3.79ICDD9 pKa = 3.31KK10 pKa = 11.1GVVSGKK16 pKa = 10.1QYY18 pKa = 10.63SHH20 pKa = 6.33SHH22 pKa = 5.27RR23 pKa = 11.84QSNRR27 pKa = 11.84TWAPNIKK34 pKa = 9.58KK35 pKa = 10.2VKK37 pKa = 10.08AIVKK41 pKa = 7.32GTPKK45 pKa = 9.67TVHH48 pKa = 4.9VCTRR52 pKa = 11.84CLRR55 pKa = 11.84SGKK58 pKa = 7.37VQRR61 pKa = 11.84AII63 pKa = 3.7
Molecular weight: 7.12 kDa
Isoelectric point according different methods:
Peptides (in silico digests for buttom-up proteomics)
Below you can find in silico digests of the whole proteome with Trypsin, Chymotrypsin, Trypsin+LysC, LysN, ArgC proteases suitable for different mass spec machines.| Try ESI |
 |
|---|
| ChTry ESI |
|
|---|
| ArgC ESI |
|
|---|
| LysN ESI |
|
|---|
| TryLysC ESI |
|
|---|
| Try MALDI |
|
|---|
| ChTry MALDI |
|
|---|
| ArgC MALDI |
|
|---|
| LysN MALDI |
|
|---|
| TryLysC MALDI |
|
|---|
| Try LTQ |
|
|---|
| ChTry LTQ |
|
|---|
| ArgC LTQ |
|
|---|
| LysN LTQ |
|
|---|
| TryLysC LTQ |
|
|---|
| Try MSlow |
|
|---|
| ChTry MSlow |
|
|---|
| ArgC MSlow |
|
|---|
| LysN MSlow |
|
|---|
| TryLysC MSlow |
|
|---|
| Try MShigh |
|
|---|
| ChTry MShigh |
|
|---|
| ArgC MShigh |
|
|---|
| LysN MShigh |
|
|---|
| TryLysC MShigh |
|
|---|
General Statistics
Number of major isoforms |
Number of additional isoforms |
Number of all proteins |
Number of amino acids |
Min. Seq. Length |
Max. Seq. Length |
Avg. Seq. Length |
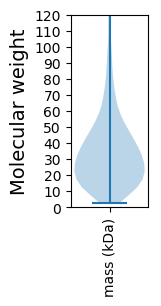
Avg. Mol. Weight |
|---|---|---|---|---|---|---|---|
0 |
1102011 |
19 |
4519 |
341.7 |
38.7 |
Amino acid frequency
Ala |
Cys |
Asp |
Glu |
Phe |
Gly |
His |
Ile |
Lys |
Leu |
|---|---|---|---|---|---|---|---|---|---|
4.987 ± 0.048 | 1.141 ± 0.018 |
5.296 ± 0.044 | 7.315 ± 0.059 |
4.59 ± 0.036 | 6.145 ± 0.05 |
1.299 ± 0.021 | 10.374 ± 0.058 |
9.651 ± 0.061 | 9.067 ± 0.054 |
Met |
Asn |
Gln |
Pro |
Arg |
Ser |
Thr |
Val |
Trp |
Tyr |
|---|---|---|---|---|---|---|---|---|---|
2.24 ± 0.022 | 7.756 ± 0.058 |
2.743 ± 0.03 | 2.084 ± 0.018 |
2.86 ± 0.027 | 6.294 ± 0.04 |
5.178 ± 0.054 | 6.032 ± 0.041 |
0.736 ± 0.018 | 4.212 ± 0.027 |
Most of the basic statistics you can see at this page can be downloaded from this CSV file
See this proteome in:

Proteome-pI is available under Creative Commons Attribution-NoDerivs license, for more details see here
| Reference: Kozlowski LP. Proteome-pI 2.0: Proteome Isoelectric Point Database Update. Nucleic Acids Res. 2021, doi: 10.1093/nar/gkab944 | Contact: Lukasz P. Kozlowski |