Halomonas ilicicola DSM 19980
Taxonomy: cellular organisms; Bacteria; Proteobacteria; Gammaproteobacteria; Oceanospirillales; Halomonadaceae; Halomonas; Halomonas ilicicola
Average proteome isoelectric point is 6.16
Get precalculated fractions of proteins

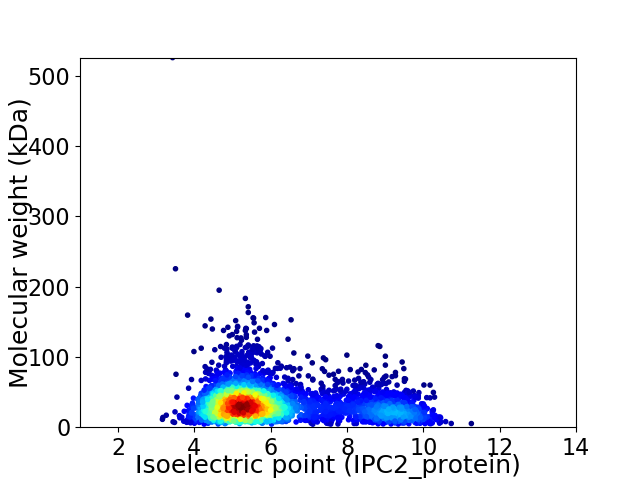
Virtual 2D-PAGE plot for 3660 proteins (isoelectric point calculated using IPC2_protein)
Get csv file with sequences according to given criteria:
* You can choose from 21 different methods for calculating isoelectric point
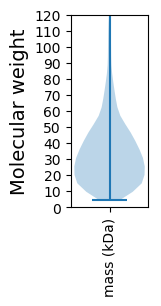
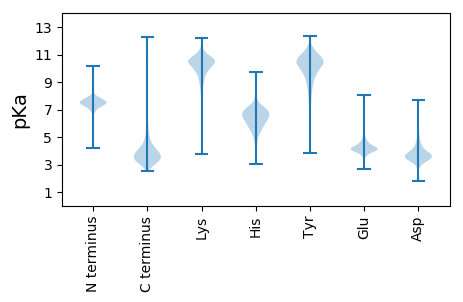
Summary statistics related to proteome-wise predictions


Protein with the lowest isoelectric point:
>tr|A0A1M5BC90|A0A1M5BC90_9GAMM Ubiquinone biosynthesis protein OS=Halomonas ilicicola DSM 19980 OX=1121942 GN=SAMN02745148_02510 PE=4 SV=1
MM1 pKa = 7.32RR2 pKa = 11.84TLHH5 pKa = 5.84TFMLAGALTALALPAAAASGHH26 pKa = 5.15WSVGAEE32 pKa = 4.01VGTTGYY38 pKa = 10.52GGSLSYY44 pKa = 10.56RR45 pKa = 11.84FHH47 pKa = 8.08DD48 pKa = 4.19NLALTAGYY56 pKa = 10.58SGFTYY61 pKa = 10.89DD62 pKa = 4.94DD63 pKa = 3.63IEE65 pKa = 4.83YY66 pKa = 8.19EE67 pKa = 4.18TDD69 pKa = 3.32DD70 pKa = 4.07ADD72 pKa = 3.87YY73 pKa = 11.47DD74 pKa = 4.18GDD76 pKa = 3.52VDD78 pKa = 3.66MDD80 pKa = 4.26VYY82 pKa = 11.41GLTLDD87 pKa = 3.64YY88 pKa = 10.93FPFGGRR94 pKa = 11.84FFLSAGAVKK103 pKa = 10.07PDD105 pKa = 3.1IAALVIGRR113 pKa = 11.84PKK115 pKa = 10.64DD116 pKa = 3.7GQSYY120 pKa = 9.34EE121 pKa = 4.38YY122 pKa = 11.04NGNTYY127 pKa = 7.95TAEE130 pKa = 4.04EE131 pKa = 4.46VGTLRR136 pKa = 11.84GDD138 pKa = 3.37VTLGDD143 pKa = 4.39SIQPYY148 pKa = 10.42LGLGWRR154 pKa = 11.84GSHH157 pKa = 6.73KK158 pKa = 10.74SGLGVFAKK166 pKa = 10.63LGAFLTDD173 pKa = 3.21AEE175 pKa = 4.78VNLEE179 pKa = 4.02ASGAASDD186 pKa = 3.7PQLRR190 pKa = 11.84EE191 pKa = 4.71DD192 pKa = 3.61IQQEE196 pKa = 4.03EE197 pKa = 5.37DD198 pKa = 3.93DD199 pKa = 4.67LQDD202 pKa = 4.11DD203 pKa = 3.68VDD205 pKa = 3.9EE206 pKa = 5.23FGVYY210 pKa = 9.34PVAVLGLEE218 pKa = 4.23YY219 pKa = 10.68TFF221 pKa = 5.29
MM1 pKa = 7.32RR2 pKa = 11.84TLHH5 pKa = 5.84TFMLAGALTALALPAAAASGHH26 pKa = 5.15WSVGAEE32 pKa = 4.01VGTTGYY38 pKa = 10.52GGSLSYY44 pKa = 10.56RR45 pKa = 11.84FHH47 pKa = 8.08DD48 pKa = 4.19NLALTAGYY56 pKa = 10.58SGFTYY61 pKa = 10.89DD62 pKa = 4.94DD63 pKa = 3.63IEE65 pKa = 4.83YY66 pKa = 8.19EE67 pKa = 4.18TDD69 pKa = 3.32DD70 pKa = 4.07ADD72 pKa = 3.87YY73 pKa = 11.47DD74 pKa = 4.18GDD76 pKa = 3.52VDD78 pKa = 3.66MDD80 pKa = 4.26VYY82 pKa = 11.41GLTLDD87 pKa = 3.64YY88 pKa = 10.93FPFGGRR94 pKa = 11.84FFLSAGAVKK103 pKa = 10.07PDD105 pKa = 3.1IAALVIGRR113 pKa = 11.84PKK115 pKa = 10.64DD116 pKa = 3.7GQSYY120 pKa = 9.34EE121 pKa = 4.38YY122 pKa = 11.04NGNTYY127 pKa = 7.95TAEE130 pKa = 4.04EE131 pKa = 4.46VGTLRR136 pKa = 11.84GDD138 pKa = 3.37VTLGDD143 pKa = 4.39SIQPYY148 pKa = 10.42LGLGWRR154 pKa = 11.84GSHH157 pKa = 6.73KK158 pKa = 10.74SGLGVFAKK166 pKa = 10.63LGAFLTDD173 pKa = 3.21AEE175 pKa = 4.78VNLEE179 pKa = 4.02ASGAASDD186 pKa = 3.7PQLRR190 pKa = 11.84EE191 pKa = 4.71DD192 pKa = 3.61IQQEE196 pKa = 4.03EE197 pKa = 5.37DD198 pKa = 3.93DD199 pKa = 4.67LQDD202 pKa = 4.11DD203 pKa = 3.68VDD205 pKa = 3.9EE206 pKa = 5.23FGVYY210 pKa = 9.34PVAVLGLEE218 pKa = 4.23YY219 pKa = 10.68TFF221 pKa = 5.29
Molecular weight: 23.66 kDa
Isoelectric point according different methods:
Protein with the highest isoelectric point:
>tr|A0A1M4VVQ6|A0A1M4VVQ6_9GAMM Iron-sulfur cluster insertion protein ErpA OS=Halomonas ilicicola DSM 19980 OX=1121942 GN=erpA PE=3 SV=1
MM1 pKa = 7.45KK2 pKa = 9.51RR3 pKa = 11.84TFQPSVLKK11 pKa = 10.34RR12 pKa = 11.84KK13 pKa = 9.1RR14 pKa = 11.84VHH16 pKa = 6.26GFRR19 pKa = 11.84ARR21 pKa = 11.84MATKK25 pKa = 10.4NGRR28 pKa = 11.84QVLARR33 pKa = 11.84RR34 pKa = 11.84RR35 pKa = 11.84AKK37 pKa = 9.93GRR39 pKa = 11.84KK40 pKa = 8.85RR41 pKa = 11.84LSAA44 pKa = 3.96
MM1 pKa = 7.45KK2 pKa = 9.51RR3 pKa = 11.84TFQPSVLKK11 pKa = 10.34RR12 pKa = 11.84KK13 pKa = 9.1RR14 pKa = 11.84VHH16 pKa = 6.26GFRR19 pKa = 11.84ARR21 pKa = 11.84MATKK25 pKa = 10.4NGRR28 pKa = 11.84QVLARR33 pKa = 11.84RR34 pKa = 11.84RR35 pKa = 11.84AKK37 pKa = 9.93GRR39 pKa = 11.84KK40 pKa = 8.85RR41 pKa = 11.84LSAA44 pKa = 3.96
Molecular weight: 5.21 kDa
Isoelectric point according different methods:
Peptides (in silico digests for buttom-up proteomics)
Below you can find in silico digests of the whole proteome with Trypsin, Chymotrypsin, Trypsin+LysC, LysN, ArgC proteases suitable for different mass spec machines.| Try ESI |
 |
|---|
| ChTry ESI |
 |
|---|
| ArgC ESI |
 |
|---|
| LysN ESI |
 |
|---|
| TryLysC ESI |
 |
|---|
| Try MALDI |
 |
|---|
| ChTry MALDI |
 |
|---|
| ArgC MALDI |
 |
|---|
| LysN MALDI |
 |
|---|
| TryLysC MALDI |
 |
|---|
| Try LTQ |
 |
|---|
| ChTry LTQ |
 |
|---|
| ArgC LTQ |
 |
|---|
| LysN LTQ |
 |
|---|
| TryLysC LTQ |
 |
|---|
| Try MSlow |
 |
|---|
| ChTry MSlow |
 |
|---|
| ArgC MSlow |
 |
|---|
| LysN MSlow |
 |
|---|
| TryLysC MSlow |
 |
|---|
| Try MShigh |
 |
|---|
| ChTry MShigh |
 |
|---|
| ArgC MShigh |
 |
|---|
| LysN MShigh |
 |
|---|
| TryLysC MShigh |
 |
|---|
General Statistics
Number of major isoforms |
Number of additional isoforms |
Number of all proteins |
Number of amino acids |
Min. Seq. Length |
Max. Seq. Length |
Avg. Seq. Length |
Avg. Mol. Weight |
|---|---|---|---|---|---|---|---|
0 |
1184749 |
39 |
5047 |
323.7 |
35.61 |
Amino acid frequency
Ala |
Cys |
Asp |
Glu |
Phe |
Gly |
His |
Ile |
Lys |
Leu |
|---|---|---|---|---|---|---|---|---|---|
10.945 ± 0.051 | 0.918 ± 0.016 |
5.82 ± 0.039 | 6.585 ± 0.047 |
3.506 ± 0.026 | 8.234 ± 0.045 |
2.407 ± 0.026 | 4.819 ± 0.031 |
2.738 ± 0.029 | 11.535 ± 0.068 |
Met |
Asn |
Gln |
Pro |
Arg |
Ser |
Thr |
Val |
Trp |
Tyr |
|---|---|---|---|---|---|---|---|---|---|
2.46 ± 0.02 | 2.562 ± 0.028 |
4.883 ± 0.029 | 3.804 ± 0.028 |
7.433 ± 0.053 | 5.391 ± 0.031 |
4.97 ± 0.031 | 7.082 ± 0.033 |
1.502 ± 0.021 | 2.409 ± 0.022 |
Most of the basic statistics you can see at this page can be downloaded from this CSV file
Proteome-pI is available under Creative Commons Attribution-NoDerivs license, for more details see here
| Reference: Kozlowski LP. Proteome-pI 2.0: Proteome Isoelectric Point Database Update. Nucleic Acids Res. 2021, doi: 10.1093/nar/gkab944 | Contact: Lukasz P. Kozlowski |
