Blackberry vein banding-associated virus
Taxonomy: Viruses; Riboviria; Orthornavirae; Kitrinoviricota; Alsuviricetes; Martellivirales; Closteroviridae; Ampelovirus
Average proteome isoelectric point is 6.82
Get precalculated fractions of proteins

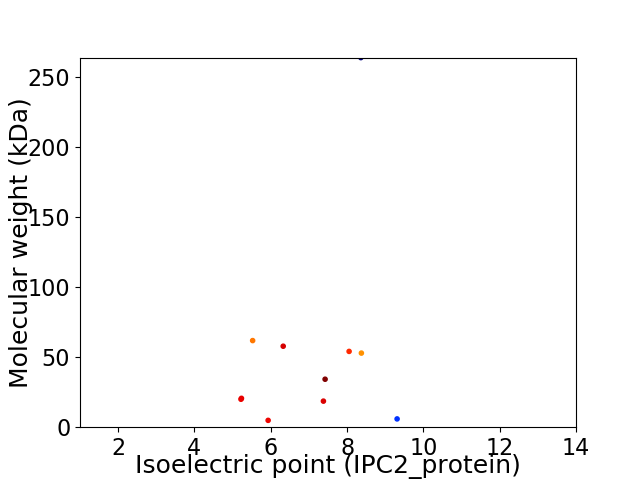
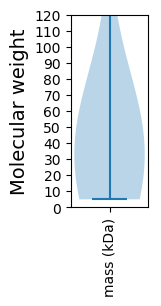
Virtual 2D-PAGE plot for 11 proteins (isoelectric point calculated using IPC2_protein)
Get csv file with sequences according to given criteria:
* You can choose from 21 different methods for calculating isoelectric point
Summary statistics related to proteome-wise predictions


Protein with the lowest isoelectric point:
>tr|S5U8X6|S5U8X6_9CLOS RNA-dependent RNA polymerase 1b OS=Blackberry vein banding-associated virus OX=1381464 PE=4 SV=1
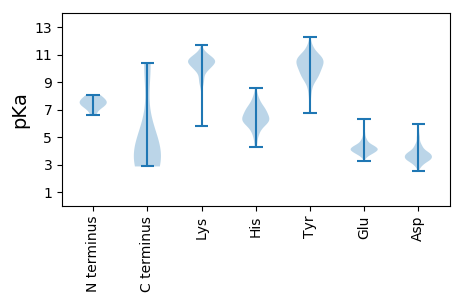
MM1 pKa = 7.44EE2 pKa = 5.87FKK4 pKa = 10.54PVTIKK9 pKa = 10.53VSKK12 pKa = 9.89VGSGEE17 pKa = 3.73IVPYY21 pKa = 10.1NVEE24 pKa = 4.35SIDD27 pKa = 3.67MVSYY31 pKa = 11.55ALFDD35 pKa = 3.54NVKK38 pKa = 10.36DD39 pKa = 3.86FRR41 pKa = 11.84VVSKK45 pKa = 10.41EE46 pKa = 3.8DD47 pKa = 3.36SSTLSEE53 pKa = 4.67GYY55 pKa = 8.24STNSAFILNPYY66 pKa = 9.36KK67 pKa = 10.64IFGAVFDD74 pKa = 4.72KK75 pKa = 10.88SGKK78 pKa = 10.37AIATDD83 pKa = 3.43VASVFRR89 pKa = 11.84VYY91 pKa = 10.9DD92 pKa = 3.02LHH94 pKa = 8.09NYY96 pKa = 8.35VVEE99 pKa = 4.6KK100 pKa = 10.56IGDD103 pKa = 3.23IALYY107 pKa = 10.53KK108 pKa = 10.2RR109 pKa = 11.84VTYY112 pKa = 10.47LCEE115 pKa = 3.9YY116 pKa = 10.17DD117 pKa = 3.75SLGGSVEE124 pKa = 4.4TITVKK129 pKa = 10.27VVKK132 pKa = 10.33DD133 pKa = 3.67DD134 pKa = 3.68GTIVDD139 pKa = 3.81VVIDD143 pKa = 4.1NNHH146 pKa = 6.01KK147 pKa = 10.31CWAGLKK153 pKa = 9.84KK154 pKa = 10.73DD155 pKa = 4.49LVWEE159 pKa = 4.12QNQARR164 pKa = 11.84TLKK167 pKa = 10.94GKK169 pKa = 10.12DD170 pKa = 3.17VLDD173 pKa = 3.82AVLLLEE179 pKa = 4.79NYY181 pKa = 9.93PGFKK185 pKa = 10.39
MM1 pKa = 7.44EE2 pKa = 5.87FKK4 pKa = 10.54PVTIKK9 pKa = 10.53VSKK12 pKa = 9.89VGSGEE17 pKa = 3.73IVPYY21 pKa = 10.1NVEE24 pKa = 4.35SIDD27 pKa = 3.67MVSYY31 pKa = 11.55ALFDD35 pKa = 3.54NVKK38 pKa = 10.36DD39 pKa = 3.86FRR41 pKa = 11.84VVSKK45 pKa = 10.41EE46 pKa = 3.8DD47 pKa = 3.36SSTLSEE53 pKa = 4.67GYY55 pKa = 8.24STNSAFILNPYY66 pKa = 9.36KK67 pKa = 10.64IFGAVFDD74 pKa = 4.72KK75 pKa = 10.88SGKK78 pKa = 10.37AIATDD83 pKa = 3.43VASVFRR89 pKa = 11.84VYY91 pKa = 10.9DD92 pKa = 3.02LHH94 pKa = 8.09NYY96 pKa = 8.35VVEE99 pKa = 4.6KK100 pKa = 10.56IGDD103 pKa = 3.23IALYY107 pKa = 10.53KK108 pKa = 10.2RR109 pKa = 11.84VTYY112 pKa = 10.47LCEE115 pKa = 3.9YY116 pKa = 10.17DD117 pKa = 3.75SLGGSVEE124 pKa = 4.4TITVKK129 pKa = 10.27VVKK132 pKa = 10.33DD133 pKa = 3.67DD134 pKa = 3.68GTIVDD139 pKa = 3.81VVIDD143 pKa = 4.1NNHH146 pKa = 6.01KK147 pKa = 10.31CWAGLKK153 pKa = 9.84KK154 pKa = 10.73DD155 pKa = 4.49LVWEE159 pKa = 4.12QNQARR164 pKa = 11.84TLKK167 pKa = 10.94GKK169 pKa = 10.12DD170 pKa = 3.17VLDD173 pKa = 3.82AVLLLEE179 pKa = 4.79NYY181 pKa = 9.93PGFKK185 pKa = 10.39
Molecular weight: 20.61 kDa
Isoelectric point according different methods:
Protein with the highest isoelectric point:
>tr|S5TIV9|S5TIV9_9CLOS Minor coat protein OS=Blackberry vein banding-associated virus OX=1381464 PE=4 SV=1
MM1 pKa = 6.58VRR3 pKa = 11.84KK4 pKa = 9.93VFLPCNVEE12 pKa = 3.73GWRR15 pKa = 11.84LRR17 pKa = 11.84RR18 pKa = 11.84WLYY21 pKa = 8.73ISVYY25 pKa = 9.73IVSTACTASLVLLGCFPPRR44 pKa = 11.84SFYY47 pKa = 10.26LTWW50 pKa = 4.82
MM1 pKa = 6.58VRR3 pKa = 11.84KK4 pKa = 9.93VFLPCNVEE12 pKa = 3.73GWRR15 pKa = 11.84LRR17 pKa = 11.84RR18 pKa = 11.84WLYY21 pKa = 8.73ISVYY25 pKa = 9.73IVSTACTASLVLLGCFPPRR44 pKa = 11.84SFYY47 pKa = 10.26LTWW50 pKa = 4.82
Molecular weight: 5.91 kDa
Isoelectric point according different methods:
Peptides (in silico digests for buttom-up proteomics)
Below you can find in silico digests of the whole proteome with Trypsin, Chymotrypsin, Trypsin+LysC, LysN, ArgC proteases suitable for different mass spec machines.| Try ESI |
 |
|---|
| ChTry ESI |
 |
|---|
| ArgC ESI |
 |
|---|
| LysN ESI |
 |
|---|
| TryLysC ESI |
 |
|---|
| Try MALDI |
 |
|---|
| ChTry MALDI |
 |
|---|
| ArgC MALDI |
 |
|---|
| LysN MALDI |
 |
|---|
| TryLysC MALDI |
 |
|---|
| Try LTQ |
 |
|---|
| ChTry LTQ |
 |
|---|
| ArgC LTQ |
 |
|---|
| LysN LTQ |
 |
|---|
| TryLysC LTQ |
 |
|---|
| Try MSlow |
 |
|---|
| ChTry MSlow |
 |
|---|
| ArgC MSlow |
 |
|---|
| LysN MSlow |
 |
|---|
| TryLysC MSlow |
 |
|---|
| Try MShigh |
 |
|---|
| ChTry MShigh |
 |
|---|
| ArgC MShigh |
 |
|---|
| LysN MShigh |
 |
|---|
| TryLysC MShigh |
 |
|---|
General Statistics
Number of major isoforms |
Number of additional isoforms |
Number of all proteins |
Number of amino acids |
Min. Seq. Length |
Max. Seq. Length |
Avg. Seq. Length |
Avg. Mol. Weight |
|---|---|---|---|---|---|---|---|
0 |
5363 |
44 |
2384 |
487.5 |
54.07 |
Amino acid frequency
Ala |
Cys |
Asp |
Glu |
Phe |
Gly |
His |
Ile |
Lys |
Leu |
|---|---|---|---|---|---|---|---|---|---|
6.936 ± 0.388 | 1.995 ± 0.285 |
5.445 ± 0.377 | 5.687 ± 0.247 |
4.139 ± 0.327 | 6.769 ± 0.452 |
1.287 ± 0.288 | 4.233 ± 0.278 |
6.004 ± 0.258 | 9.64 ± 0.732 |
Met |
Asn |
Gln |
Pro |
Arg |
Ser |
Thr |
Val |
Trp |
Tyr |
|---|---|---|---|---|---|---|---|---|---|
2.2 ± 0.306 | 3.729 ± 0.438 |
3.841 ± 0.455 | 2.014 ± 0.207 |
6.47 ± 0.443 | 8.298 ± 0.309 |
6.172 ± 0.33 | 10.535 ± 0.437 |
0.746 ± 0.1 | 3.86 ± 0.188 |
Most of the basic statistics you can see at this page can be downloaded from this CSV file
Proteome-pI is available under Creative Commons Attribution-NoDerivs license, for more details see here
| Reference: Kozlowski LP. Proteome-pI 2.0: Proteome Isoelectric Point Database Update. Nucleic Acids Res. 2021, doi: 10.1093/nar/gkab944 | Contact: Lukasz P. Kozlowski |
