Blastocystis sp. subtype 1 (strain ATCC 50177 / NandII)
Taxonomy: cellular organisms; Eukaryota; Sar; Stramenopiles; Bigyra; Opalozoa; Opalinata; Blastocystidae; Blastocystis; Blastocystis sp. subtypes; Blastocystis sp. subtype 1
Average proteome isoelectric point is 6.2
Get precalculated fractions of proteins

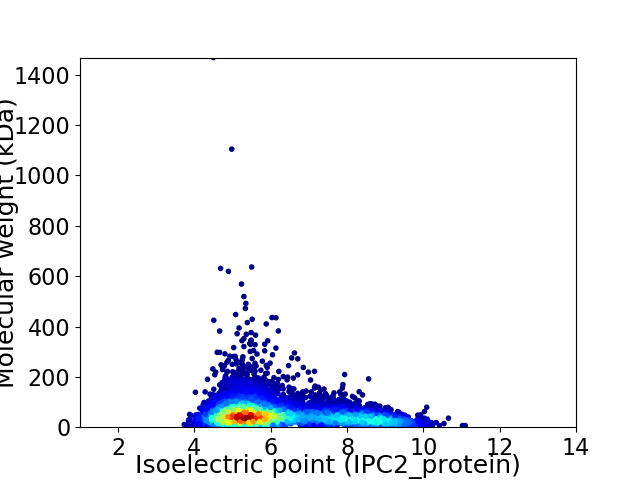
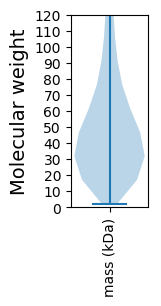
Virtual 2D-PAGE plot for 6377 proteins (isoelectric point calculated using IPC2_protein)
Get csv file with sequences according to given criteria:
* You can choose from 21 different methods for calculating isoelectric point
Summary statistics related to proteome-wise predictions


Protein with the lowest isoelectric point:
>tr|A0A196S7T1|A0A196S7T1_BLAHN Eukaryotic initiation factor 4A-III OS=Blastocystis sp. subtype 1 (strain ATCC 50177 / NandII) OX=478820 GN=AV274_6182 PE=4 SV=1
MM1 pKa = 7.41SVTEE5 pKa = 4.19STRR8 pKa = 11.84EE9 pKa = 3.94AGLDD13 pKa = 3.43LAKK16 pKa = 10.75NDD18 pKa = 4.44LLYY21 pKa = 10.78TFDD24 pKa = 4.68GVEE27 pKa = 4.15CMVNQAQSHH36 pKa = 5.0SAGTLYY42 pKa = 9.55LTKK45 pKa = 10.87DD46 pKa = 3.28NLVFVAPEE54 pKa = 4.26GEE56 pKa = 4.43DD57 pKa = 3.37YY58 pKa = 11.33SLAIEE63 pKa = 4.18YY64 pKa = 8.79PAIGVHH70 pKa = 6.49AVCQEE75 pKa = 3.64DD76 pKa = 4.45TLWKK80 pKa = 10.11RR81 pKa = 11.84PCIYY85 pKa = 10.5CQICDD90 pKa = 4.03PQAEE94 pKa = 4.49DD95 pKa = 3.31SGEE98 pKa = 4.16VNVICGDD105 pKa = 3.67PSFDD109 pKa = 4.56AFDD112 pKa = 3.25QGEE115 pKa = 4.18EE116 pKa = 4.08VEE118 pKa = 4.33EE119 pKa = 4.89GEE121 pKa = 4.63EE122 pKa = 4.14EE123 pKa = 4.13EE124 pKa = 4.74DD125 pKa = 3.56DD126 pKa = 4.22GSIFEE131 pKa = 4.61VLFSPLEE138 pKa = 4.01TEE140 pKa = 5.03KK141 pKa = 10.47IDD143 pKa = 4.11SVFDD147 pKa = 4.46GISRR151 pKa = 11.84LQVMHH156 pKa = 7.48PDD158 pKa = 3.44PVKK161 pKa = 10.84EE162 pKa = 4.01EE163 pKa = 4.5EE164 pKa = 4.14EE165 pKa = 4.93DD166 pKa = 3.91NMFMTANGLVSVEE179 pKa = 4.2DD180 pKa = 4.65HH181 pKa = 6.32ICSLFEE187 pKa = 3.76KK188 pKa = 10.51AAAEE192 pKa = 4.3YY193 pKa = 10.19EE194 pKa = 4.63GKK196 pKa = 10.14DD197 pKa = 3.37HH198 pKa = 6.92EE199 pKa = 4.47
MM1 pKa = 7.41SVTEE5 pKa = 4.19STRR8 pKa = 11.84EE9 pKa = 3.94AGLDD13 pKa = 3.43LAKK16 pKa = 10.75NDD18 pKa = 4.44LLYY21 pKa = 10.78TFDD24 pKa = 4.68GVEE27 pKa = 4.15CMVNQAQSHH36 pKa = 5.0SAGTLYY42 pKa = 9.55LTKK45 pKa = 10.87DD46 pKa = 3.28NLVFVAPEE54 pKa = 4.26GEE56 pKa = 4.43DD57 pKa = 3.37YY58 pKa = 11.33SLAIEE63 pKa = 4.18YY64 pKa = 8.79PAIGVHH70 pKa = 6.49AVCQEE75 pKa = 3.64DD76 pKa = 4.45TLWKK80 pKa = 10.11RR81 pKa = 11.84PCIYY85 pKa = 10.5CQICDD90 pKa = 4.03PQAEE94 pKa = 4.49DD95 pKa = 3.31SGEE98 pKa = 4.16VNVICGDD105 pKa = 3.67PSFDD109 pKa = 4.56AFDD112 pKa = 3.25QGEE115 pKa = 4.18EE116 pKa = 4.08VEE118 pKa = 4.33EE119 pKa = 4.89GEE121 pKa = 4.63EE122 pKa = 4.14EE123 pKa = 4.13EE124 pKa = 4.74DD125 pKa = 3.56DD126 pKa = 4.22GSIFEE131 pKa = 4.61VLFSPLEE138 pKa = 4.01TEE140 pKa = 5.03KK141 pKa = 10.47IDD143 pKa = 4.11SVFDD147 pKa = 4.46GISRR151 pKa = 11.84LQVMHH156 pKa = 7.48PDD158 pKa = 3.44PVKK161 pKa = 10.84EE162 pKa = 4.01EE163 pKa = 4.5EE164 pKa = 4.14EE165 pKa = 4.93DD166 pKa = 3.91NMFMTANGLVSVEE179 pKa = 4.2DD180 pKa = 4.65HH181 pKa = 6.32ICSLFEE187 pKa = 3.76KK188 pKa = 10.51AAAEE192 pKa = 4.3YY193 pKa = 10.19EE194 pKa = 4.63GKK196 pKa = 10.14DD197 pKa = 3.37HH198 pKa = 6.92EE199 pKa = 4.47
Molecular weight: 22.09 kDa
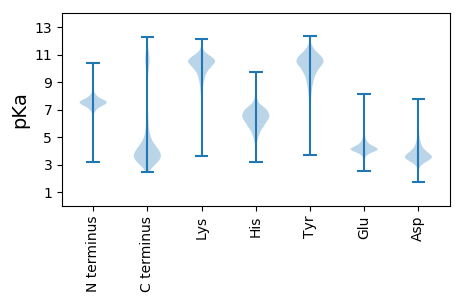
Isoelectric point according different methods:
Protein with the highest isoelectric point:
>tr|A0A196SL45|A0A196SL45_BLAHN Drug/Metabolite Transporter (DMT) Superfamily OS=Blastocystis sp. subtype 1 (strain ATCC 50177 / NandII) OX=478820 GN=AV274_1270 PE=3 SV=1
MM1 pKa = 7.94PSQKK5 pKa = 10.37SFRR8 pKa = 11.84TKK10 pKa = 10.44RR11 pKa = 11.84ILAKK15 pKa = 10.37KK16 pKa = 8.59MRR18 pKa = 11.84QNRR21 pKa = 11.84PIPQWFRR28 pKa = 11.84LRR30 pKa = 11.84TGNTIRR36 pKa = 11.84YY37 pKa = 5.79NAKK40 pKa = 8.63RR41 pKa = 11.84RR42 pKa = 11.84HH43 pKa = 4.6WKK45 pKa = 8.07RR46 pKa = 11.84TKK48 pKa = 10.75LGII51 pKa = 3.98
MM1 pKa = 7.94PSQKK5 pKa = 10.37SFRR8 pKa = 11.84TKK10 pKa = 10.44RR11 pKa = 11.84ILAKK15 pKa = 10.37KK16 pKa = 8.59MRR18 pKa = 11.84QNRR21 pKa = 11.84PIPQWFRR28 pKa = 11.84LRR30 pKa = 11.84TGNTIRR36 pKa = 11.84YY37 pKa = 5.79NAKK40 pKa = 8.63RR41 pKa = 11.84RR42 pKa = 11.84HH43 pKa = 4.6WKK45 pKa = 8.07RR46 pKa = 11.84TKK48 pKa = 10.75LGII51 pKa = 3.98
Molecular weight: 6.35 kDa
Isoelectric point according different methods:
Peptides (in silico digests for buttom-up proteomics)
Below you can find in silico digests of the whole proteome with Trypsin, Chymotrypsin, Trypsin+LysC, LysN, ArgC proteases suitable for different mass spec machines.| Try ESI |
 |
|---|
| ChTry ESI |
 |
|---|
| ArgC ESI |
 |
|---|
| LysN ESI |
 |
|---|
| TryLysC ESI |
 |
|---|
| Try MALDI |
 |
|---|
| ChTry MALDI |
 |
|---|
| ArgC MALDI |
 |
|---|
| LysN MALDI |
 |
|---|
| TryLysC MALDI |
 |
|---|
| Try LTQ |
 |
|---|
| ChTry LTQ |
 |
|---|
| ArgC LTQ |
 |
|---|
| LysN LTQ |
 |
|---|
| TryLysC LTQ |
 |
|---|
| Try MSlow |
 |
|---|
| ChTry MSlow |
 |
|---|
| ArgC MSlow |
 |
|---|
| LysN MSlow |
 |
|---|
| TryLysC MSlow |
 |
|---|
| Try MShigh |
 |
|---|
| ChTry MShigh |
 |
|---|
| ArgC MShigh |
 |
|---|
| LysN MShigh |
 |
|---|
| TryLysC MShigh |
 |
|---|
General Statistics
Number of major isoforms |
Number of additional isoforms |
Number of all proteins |
Number of amino acids |
Min. Seq. Length |
Max. Seq. Length |
Avg. Seq. Length |
Avg. Mol. Weight |
|---|---|---|---|---|---|---|---|
0 |
3227170 |
19 |
13458 |
506.1 |
56.82 |
Amino acid frequency
Ala |
Cys |
Asp |
Glu |
Phe |
Gly |
His |
Ile |
Lys |
Leu |
|---|---|---|---|---|---|---|---|---|---|
7.595 ± 0.04 | 2.175 ± 0.017 |
5.257 ± 0.019 | 7.71 ± 0.05 |
4.231 ± 0.023 | 5.447 ± 0.031 |
2.089 ± 0.012 | 4.913 ± 0.027 |
6.006 ± 0.041 | 9.553 ± 0.037 |
Met |
Asn |
Gln |
Pro |
Arg |
Ser |
Thr |
Val |
Trp |
Tyr |
|---|---|---|---|---|---|---|---|---|---|
2.711 ± 0.014 | 4.018 ± 0.019 |
4.552 ± 0.028 | 3.625 ± 0.02 |
5.304 ± 0.025 | 7.493 ± 0.03 |
5.344 ± 0.023 | 7.52 ± 0.036 |
1.03 ± 0.009 | 3.398 ± 0.019 |
Most of the basic statistics you can see at this page can be downloaded from this CSV file
Proteome-pI is available under Creative Commons Attribution-NoDerivs license, for more details see here
| Reference: Kozlowski LP. Proteome-pI 2.0: Proteome Isoelectric Point Database Update. Nucleic Acids Res. 2021, doi: 10.1093/nar/gkab944 | Contact: Lukasz P. Kozlowski |
