Ruminiclostridium cellulolyticum (strain ATCC 35319 / DSM 5812 / JCM 6584 / H10) (Clostridium cellulolyticum)
Taxonomy: cellular organisms; Bacteria; Terrabacteria group; Firmicutes; Clostridia; Eubacteriales; Oscillospiraceae; Ruminiclostridium; Ruminiclostridium cellulolyticum
Average proteome isoelectric point is 6.54
Get precalculated fractions of proteins

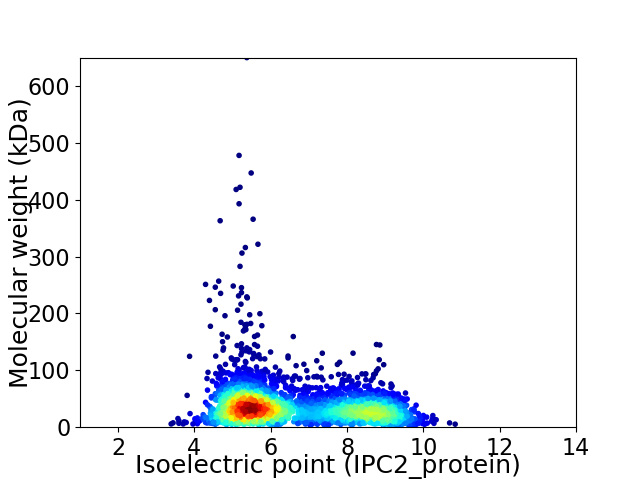
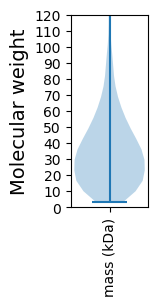
Virtual 2D-PAGE plot for 3287 proteins (isoelectric point calculated using IPC2_protein)
Get csv file with sequences according to given criteria:
* You can choose from 21 different methods for calculating isoelectric point
Summary statistics related to proteome-wise predictions


Protein with the lowest isoelectric point:
>tr|B8I8E5|B8I8E5_RUMCH Uncharacterized protein OS=Ruminiclostridium cellulolyticum (strain ATCC 35319 / DSM 5812 / JCM 6584 / H10) OX=394503 GN=Ccel_2951 PE=4 SV=1
MM1 pKa = 7.77QEE3 pKa = 3.78EE4 pKa = 4.7NLTISIWDD12 pKa = 3.63RR13 pKa = 11.84EE14 pKa = 4.33SPINGVSAEE23 pKa = 4.67EE24 pKa = 3.82ILSYY28 pKa = 11.07CDD30 pKa = 5.53DD31 pKa = 3.59IAKK34 pKa = 10.39EE35 pKa = 3.92PVVLLFSDD43 pKa = 4.41PDD45 pKa = 3.78TGHH48 pKa = 6.42VNQIQFPNTLVNILNTHH65 pKa = 7.08DD66 pKa = 3.43SFKK69 pKa = 10.67PVNEE73 pKa = 4.05TDD75 pKa = 4.38PIVIGHH81 pKa = 7.72LYY83 pKa = 10.07LQYY86 pKa = 11.08LYY88 pKa = 10.42LINHH92 pKa = 5.95TEE94 pKa = 3.98PPKK97 pKa = 10.78SEE99 pKa = 3.97LQILQEE105 pKa = 4.35TVDD108 pKa = 3.82TLVADD113 pKa = 4.12NLNLQAQIDD122 pKa = 4.02TLITSNLQGG131 pKa = 3.42
MM1 pKa = 7.77QEE3 pKa = 3.78EE4 pKa = 4.7NLTISIWDD12 pKa = 3.63RR13 pKa = 11.84EE14 pKa = 4.33SPINGVSAEE23 pKa = 4.67EE24 pKa = 3.82ILSYY28 pKa = 11.07CDD30 pKa = 5.53DD31 pKa = 3.59IAKK34 pKa = 10.39EE35 pKa = 3.92PVVLLFSDD43 pKa = 4.41PDD45 pKa = 3.78TGHH48 pKa = 6.42VNQIQFPNTLVNILNTHH65 pKa = 7.08DD66 pKa = 3.43SFKK69 pKa = 10.67PVNEE73 pKa = 4.05TDD75 pKa = 4.38PIVIGHH81 pKa = 7.72LYY83 pKa = 10.07LQYY86 pKa = 11.08LYY88 pKa = 10.42LINHH92 pKa = 5.95TEE94 pKa = 3.98PPKK97 pKa = 10.78SEE99 pKa = 3.97LQILQEE105 pKa = 4.35TVDD108 pKa = 3.82TLVADD113 pKa = 4.12NLNLQAQIDD122 pKa = 4.02TLITSNLQGG131 pKa = 3.42
Molecular weight: 14.76 kDa
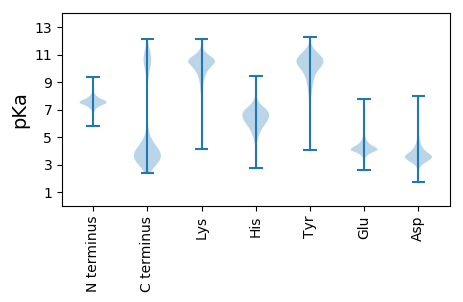
Isoelectric point according different methods:
Protein with the highest isoelectric point:
>tr|B8I1L0|B8I1L0_RUMCH Peptidase C26 OS=Ruminiclostridium cellulolyticum (strain ATCC 35319 / DSM 5812 / JCM 6584 / H10) OX=394503 GN=Ccel_3356 PE=4 SV=1
MM1 pKa = 7.56LSAIQHH7 pKa = 5.8IDD9 pKa = 2.99IFILNLIQNNLHH21 pKa = 6.2SPFMDD26 pKa = 3.14KK27 pKa = 10.91LMPAITFLGNGGAIWVIIALLLVVSKK53 pKa = 9.88KK54 pKa = 10.17HH55 pKa = 5.34RR56 pKa = 11.84VTGIMVIGALIICLIIGNFTLKK78 pKa = 10.55PIIARR83 pKa = 11.84ARR85 pKa = 11.84PCWVNTNIQLLVSSPRR101 pKa = 11.84DD102 pKa = 3.21YY103 pKa = 11.27SFPSGHH109 pKa = 5.94TMSSFAVATVLFLRR123 pKa = 11.84NRR125 pKa = 11.84RR126 pKa = 11.84YY127 pKa = 10.36GLWALLLAALISFSRR142 pKa = 11.84LYY144 pKa = 10.86LYY146 pKa = 9.91VHH148 pKa = 6.32YY149 pKa = 9.68PSDD152 pKa = 3.58VAAGLVLGVAASCLSLKK169 pKa = 10.43AIPAIINSSVKK180 pKa = 9.38IQKK183 pKa = 7.36TRR185 pKa = 11.84RR186 pKa = 3.38
MM1 pKa = 7.56LSAIQHH7 pKa = 5.8IDD9 pKa = 2.99IFILNLIQNNLHH21 pKa = 6.2SPFMDD26 pKa = 3.14KK27 pKa = 10.91LMPAITFLGNGGAIWVIIALLLVVSKK53 pKa = 9.88KK54 pKa = 10.17HH55 pKa = 5.34RR56 pKa = 11.84VTGIMVIGALIICLIIGNFTLKK78 pKa = 10.55PIIARR83 pKa = 11.84ARR85 pKa = 11.84PCWVNTNIQLLVSSPRR101 pKa = 11.84DD102 pKa = 3.21YY103 pKa = 11.27SFPSGHH109 pKa = 5.94TMSSFAVATVLFLRR123 pKa = 11.84NRR125 pKa = 11.84RR126 pKa = 11.84YY127 pKa = 10.36GLWALLLAALISFSRR142 pKa = 11.84LYY144 pKa = 10.86LYY146 pKa = 9.91VHH148 pKa = 6.32YY149 pKa = 9.68PSDD152 pKa = 3.58VAAGLVLGVAASCLSLKK169 pKa = 10.43AIPAIINSSVKK180 pKa = 9.38IQKK183 pKa = 7.36TRR185 pKa = 11.84RR186 pKa = 3.38
Molecular weight: 20.45 kDa
Isoelectric point according different methods:
Peptides (in silico digests for buttom-up proteomics)
Below you can find in silico digests of the whole proteome with Trypsin, Chymotrypsin, Trypsin+LysC, LysN, ArgC proteases suitable for different mass spec machines.| Try ESI |
 |
|---|
| ChTry ESI |
 |
|---|
| ArgC ESI |
 |
|---|
| LysN ESI |
 |
|---|
| TryLysC ESI |
 |
|---|
| Try MALDI |
 |
|---|
| ChTry MALDI |
 |
|---|
| ArgC MALDI |
 |
|---|
| LysN MALDI |
 |
|---|
| TryLysC MALDI |
 |
|---|
| Try LTQ |
 |
|---|
| ChTry LTQ |
 |
|---|
| ArgC LTQ |
 |
|---|
| LysN LTQ |
 |
|---|
| TryLysC LTQ |
 |
|---|
| Try MSlow |
 |
|---|
| ChTry MSlow |
 |
|---|
| ArgC MSlow |
 |
|---|
| LysN MSlow |
 |
|---|
| TryLysC MSlow |
 |
|---|
| Try MShigh |
 |
|---|
| ChTry MShigh |
 |
|---|
| ArgC MShigh |
 |
|---|
| LysN MShigh |
 |
|---|
| TryLysC MShigh |
 |
|---|
General Statistics
Number of major isoforms |
Number of additional isoforms |
Number of all proteins |
Number of amino acids |
Min. Seq. Length |
Max. Seq. Length |
Avg. Seq. Length |
Avg. Mol. Weight |
|---|---|---|---|---|---|---|---|
0 |
1145150 |
31 |
5854 |
348.4 |
39.04 |
Amino acid frequency
Ala |
Cys |
Asp |
Glu |
Phe |
Gly |
His |
Ile |
Lys |
Leu |
|---|---|---|---|---|---|---|---|---|---|
6.403 ± 0.04 | 1.236 ± 0.016 |
5.588 ± 0.03 | 6.644 ± 0.046 |
4.234 ± 0.032 | 6.872 ± 0.043 |
1.447 ± 0.018 | 8.62 ± 0.046 |
7.829 ± 0.041 | 8.779 ± 0.041 |
Met |
Asn |
Gln |
Pro |
Arg |
Ser |
Thr |
Val |
Trp |
Tyr |
|---|---|---|---|---|---|---|---|---|---|
2.593 ± 0.021 | 5.671 ± 0.033 |
3.267 ± 0.022 | 2.97 ± 0.024 |
3.785 ± 0.03 | 6.77 ± 0.032 |
5.561 ± 0.053 | 6.76 ± 0.042 |
0.902 ± 0.017 | 4.069 ± 0.032 |
Most of the basic statistics you can see at this page can be downloaded from this CSV file
Proteome-pI is available under Creative Commons Attribution-NoDerivs license, for more details see here
| Reference: Kozlowski LP. Proteome-pI 2.0: Proteome Isoelectric Point Database Update. Nucleic Acids Res. 2021, doi: 10.1093/nar/gkab944 | Contact: Lukasz P. Kozlowski |
