Aspergillus saccharolyticus JOP 1030-1
Taxonomy: cellular organisms; Eukaryota; Opisthokonta; Fungi; Dikarya; Ascomycota; saccharomyceta; Pezizomycotina; leotiomyceta; Eurotiomycetes; Eurotiomycetidae; Eurotiales; Aspergillaceae; Aspergillus; Aspergillus saccharolyticus
Average proteome isoelectric point is 6.53
Get precalculated fractions of proteins

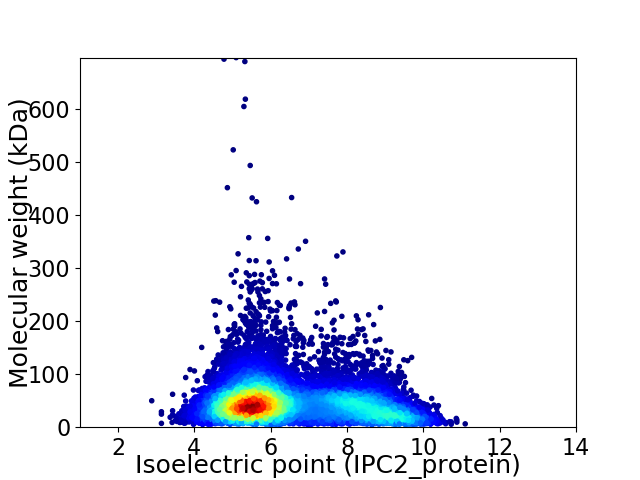
Virtual 2D-PAGE plot for 10061 proteins (isoelectric point calculated using IPC2_protein)
Get csv file with sequences according to given criteria:
* You can choose from 21 different methods for calculating isoelectric point
Summary statistics related to proteome-wise predictions


Protein with the lowest isoelectric point:
>tr|A0A319ACF1|A0A319ACF1_9EURO Uncharacterized protein OS=Aspergillus saccharolyticus JOP 1030-1 OX=1450539 GN=BP01DRAFT_388382 PE=4 SV=1
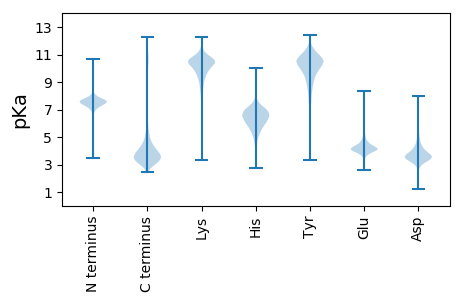
MM1 pKa = 7.11VRR3 pKa = 11.84QLALACGLLAAVAVQAAPAEE23 pKa = 4.41PAHH26 pKa = 6.16PMVTEE31 pKa = 4.51APDD34 pKa = 3.27ASLLHH39 pKa = 6.49KK40 pKa = 10.48RR41 pKa = 11.84ATTCTFSGSEE51 pKa = 4.19GASKK55 pKa = 10.64VSKK58 pKa = 10.85SKK60 pKa = 9.78TDD62 pKa = 2.91CSTIYY67 pKa = 10.59LSALAVPSGTTLDD80 pKa = 4.91LKK82 pKa = 10.98DD83 pKa = 5.0LNDD86 pKa = 3.71GTHH89 pKa = 6.5VIFEE93 pKa = 4.49GEE95 pKa = 4.12TTFGYY100 pKa = 10.01EE101 pKa = 3.67EE102 pKa = 4.39WEE104 pKa = 4.59GPLVSVSGTDD114 pKa = 3.1ITVEE118 pKa = 4.17GASGAVLNGDD128 pKa = 4.21GSRR131 pKa = 11.84WWDD134 pKa = 3.48GEE136 pKa = 3.94GSDD139 pKa = 5.38GGKK142 pKa = 8.39TKK144 pKa = 10.66PKK146 pKa = 10.23FFAAHH151 pKa = 7.33DD152 pKa = 4.23LTSSTIKK159 pKa = 10.41SIYY162 pKa = 9.57IEE164 pKa = 4.05NSPVQVFSIDD174 pKa = 3.15GSTDD178 pKa = 2.92LTMTDD183 pKa = 2.82ITIDD187 pKa = 3.65NTDD190 pKa = 3.45GDD192 pKa = 4.42TDD194 pKa = 4.09DD195 pKa = 5.53LAANTDD201 pKa = 3.28GFDD204 pKa = 3.25IGEE207 pKa = 4.38STDD210 pKa = 3.19ITITGATVYY219 pKa = 10.89NQDD222 pKa = 3.35DD223 pKa = 3.99CVAINSGEE231 pKa = 4.14NIYY234 pKa = 10.35FAAGVCSGGHH244 pKa = 5.63GLSIGSVGGRR254 pKa = 11.84DD255 pKa = 3.68DD256 pKa = 3.79NTVKK260 pKa = 10.76NVTFYY265 pKa = 11.32DD266 pKa = 3.84VNVLKK271 pKa = 10.54SQQAIRR277 pKa = 11.84IKK279 pKa = 10.53AIYY282 pKa = 9.49GDD284 pKa = 3.76TGSISDD290 pKa = 3.48ITYY293 pKa = 10.53HH294 pKa = 6.92EE295 pKa = 4.44IAFSDD300 pKa = 3.41ATDD303 pKa = 3.42YY304 pKa = 11.77GIVVEE309 pKa = 4.53QNYY312 pKa = 10.88DD313 pKa = 3.64DD314 pKa = 3.92TSKK317 pKa = 9.89TPTTGIPITDD327 pKa = 4.11FTLEE331 pKa = 4.32TIIGTCADD339 pKa = 4.59DD340 pKa = 4.66DD341 pKa = 4.05CTDD344 pKa = 3.21IYY346 pKa = 10.48IACGSGACSDD356 pKa = 3.8WSWSGVSVTGGKK368 pKa = 10.1VSTDD372 pKa = 3.51CLNVPSGISCDD383 pKa = 3.58LL384 pKa = 3.82
MM1 pKa = 7.11VRR3 pKa = 11.84QLALACGLLAAVAVQAAPAEE23 pKa = 4.41PAHH26 pKa = 6.16PMVTEE31 pKa = 4.51APDD34 pKa = 3.27ASLLHH39 pKa = 6.49KK40 pKa = 10.48RR41 pKa = 11.84ATTCTFSGSEE51 pKa = 4.19GASKK55 pKa = 10.64VSKK58 pKa = 10.85SKK60 pKa = 9.78TDD62 pKa = 2.91CSTIYY67 pKa = 10.59LSALAVPSGTTLDD80 pKa = 4.91LKK82 pKa = 10.98DD83 pKa = 5.0LNDD86 pKa = 3.71GTHH89 pKa = 6.5VIFEE93 pKa = 4.49GEE95 pKa = 4.12TTFGYY100 pKa = 10.01EE101 pKa = 3.67EE102 pKa = 4.39WEE104 pKa = 4.59GPLVSVSGTDD114 pKa = 3.1ITVEE118 pKa = 4.17GASGAVLNGDD128 pKa = 4.21GSRR131 pKa = 11.84WWDD134 pKa = 3.48GEE136 pKa = 3.94GSDD139 pKa = 5.38GGKK142 pKa = 8.39TKK144 pKa = 10.66PKK146 pKa = 10.23FFAAHH151 pKa = 7.33DD152 pKa = 4.23LTSSTIKK159 pKa = 10.41SIYY162 pKa = 9.57IEE164 pKa = 4.05NSPVQVFSIDD174 pKa = 3.15GSTDD178 pKa = 2.92LTMTDD183 pKa = 2.82ITIDD187 pKa = 3.65NTDD190 pKa = 3.45GDD192 pKa = 4.42TDD194 pKa = 4.09DD195 pKa = 5.53LAANTDD201 pKa = 3.28GFDD204 pKa = 3.25IGEE207 pKa = 4.38STDD210 pKa = 3.19ITITGATVYY219 pKa = 10.89NQDD222 pKa = 3.35DD223 pKa = 3.99CVAINSGEE231 pKa = 4.14NIYY234 pKa = 10.35FAAGVCSGGHH244 pKa = 5.63GLSIGSVGGRR254 pKa = 11.84DD255 pKa = 3.68DD256 pKa = 3.79NTVKK260 pKa = 10.76NVTFYY265 pKa = 11.32DD266 pKa = 3.84VNVLKK271 pKa = 10.54SQQAIRR277 pKa = 11.84IKK279 pKa = 10.53AIYY282 pKa = 9.49GDD284 pKa = 3.76TGSISDD290 pKa = 3.48ITYY293 pKa = 10.53HH294 pKa = 6.92EE295 pKa = 4.44IAFSDD300 pKa = 3.41ATDD303 pKa = 3.42YY304 pKa = 11.77GIVVEE309 pKa = 4.53QNYY312 pKa = 10.88DD313 pKa = 3.64DD314 pKa = 3.92TSKK317 pKa = 9.89TPTTGIPITDD327 pKa = 4.11FTLEE331 pKa = 4.32TIIGTCADD339 pKa = 4.59DD340 pKa = 4.66DD341 pKa = 4.05CTDD344 pKa = 3.21IYY346 pKa = 10.48IACGSGACSDD356 pKa = 3.8WSWSGVSVTGGKK368 pKa = 10.1VSTDD372 pKa = 3.51CLNVPSGISCDD383 pKa = 3.58LL384 pKa = 3.82
Molecular weight: 40.01 kDa
Isoelectric point according different methods:
Protein with the highest isoelectric point:
>tr|A0A318Z116|A0A318Z116_9EURO Serine/threonine-protein kinase bur1 OS=Aspergillus saccharolyticus JOP 1030-1 OX=1450539 GN=BP01DRAFT_361075 PE=4 SV=1
MM1 pKa = 7.88PSHH4 pKa = 6.91KK5 pKa = 10.39SFRR8 pKa = 11.84TKK10 pKa = 10.45QKK12 pKa = 9.54LAKK15 pKa = 9.74AQRR18 pKa = 11.84QNRR21 pKa = 11.84PIPQWIRR28 pKa = 11.84LRR30 pKa = 11.84TGNTIRR36 pKa = 11.84YY37 pKa = 5.79NAKK40 pKa = 8.89RR41 pKa = 11.84RR42 pKa = 11.84HH43 pKa = 4.14WRR45 pKa = 11.84KK46 pKa = 7.41TRR48 pKa = 11.84LGII51 pKa = 4.46
MM1 pKa = 7.88PSHH4 pKa = 6.91KK5 pKa = 10.39SFRR8 pKa = 11.84TKK10 pKa = 10.45QKK12 pKa = 9.54LAKK15 pKa = 9.74AQRR18 pKa = 11.84QNRR21 pKa = 11.84PIPQWIRR28 pKa = 11.84LRR30 pKa = 11.84TGNTIRR36 pKa = 11.84YY37 pKa = 5.79NAKK40 pKa = 8.89RR41 pKa = 11.84RR42 pKa = 11.84HH43 pKa = 4.14WRR45 pKa = 11.84KK46 pKa = 7.41TRR48 pKa = 11.84LGII51 pKa = 4.46
Molecular weight: 6.28 kDa
Isoelectric point according different methods:
Peptides (in silico digests for buttom-up proteomics)
Below you can find in silico digests of the whole proteome with Trypsin, Chymotrypsin, Trypsin+LysC, LysN, ArgC proteases suitable for different mass spec machines.| Try ESI |
 |
|---|
| ChTry ESI |
 |
|---|
| ArgC ESI |
 |
|---|
| LysN ESI |
 |
|---|
| TryLysC ESI |
 |
|---|
| Try MALDI |
 |
|---|
| ChTry MALDI |
 |
|---|
| ArgC MALDI |
 |
|---|
| LysN MALDI |
 |
|---|
| TryLysC MALDI |
 |
|---|
| Try LTQ |
 |
|---|
| ChTry LTQ |
 |
|---|
| ArgC LTQ |
 |
|---|
| LysN LTQ |
 |
|---|
| TryLysC LTQ |
 |
|---|
| Try MSlow |
 |
|---|
| ChTry MSlow |
 |
|---|
| ArgC MSlow |
 |
|---|
| LysN MSlow |
 |
|---|
| TryLysC MSlow |
 |
|---|
| Try MShigh |
 |
|---|
| ChTry MShigh |
 |
|---|
| ArgC MShigh |
 |
|---|
| LysN MShigh |
 |
|---|
| TryLysC MShigh |
 |
|---|
General Statistics
Number of major isoforms |
Number of additional isoforms |
Number of all proteins |
Number of amino acids |
Min. Seq. Length |
Max. Seq. Length |
Avg. Seq. Length |
Avg. Mol. Weight |
|---|---|---|---|---|---|---|---|
0 |
4793634 |
49 |
6402 |
476.5 |
52.7 |
Amino acid frequency
Ala |
Cys |
Asp |
Glu |
Phe |
Gly |
His |
Ile |
Lys |
Leu |
|---|---|---|---|---|---|---|---|---|---|
8.857 ± 0.023 | 1.277 ± 0.011 |
5.476 ± 0.019 | 6.115 ± 0.025 |
3.66 ± 0.017 | 6.725 ± 0.021 |
2.529 ± 0.011 | 4.764 ± 0.018 |
4.287 ± 0.022 | 9.236 ± 0.03 |
Met |
Asn |
Gln |
Pro |
Arg |
Ser |
Thr |
Val |
Trp |
Tyr |
|---|---|---|---|---|---|---|---|---|---|
2.105 ± 0.009 | 3.432 ± 0.011 |
6.101 ± 0.024 | 4.131 ± 0.015 |
6.325 ± 0.022 | 8.357 ± 0.031 |
6.124 ± 0.018 | 6.21 ± 0.019 |
1.461 ± 0.01 | 2.827 ± 0.014 |
Most of the basic statistics you can see at this page can be downloaded from this CSV file
Proteome-pI is available under Creative Commons Attribution-NoDerivs license, for more details see here
| Reference: Kozlowski LP. Proteome-pI 2.0: Proteome Isoelectric Point Database Update. Nucleic Acids Res. 2021, doi: 10.1093/nar/gkab944 | Contact: Lukasz P. Kozlowski |
