Marinospirillum alkaliphilum DSM 21637
Taxonomy: cellular organisms; Bacteria; Proteobacteria; Gammaproteobacteria; Oceanospirillales; Oceanospirillaceae; Marinospirillum; Marinospirillum alkaliphilum
Average proteome isoelectric point is 6.19
Get precalculated fractions of proteins
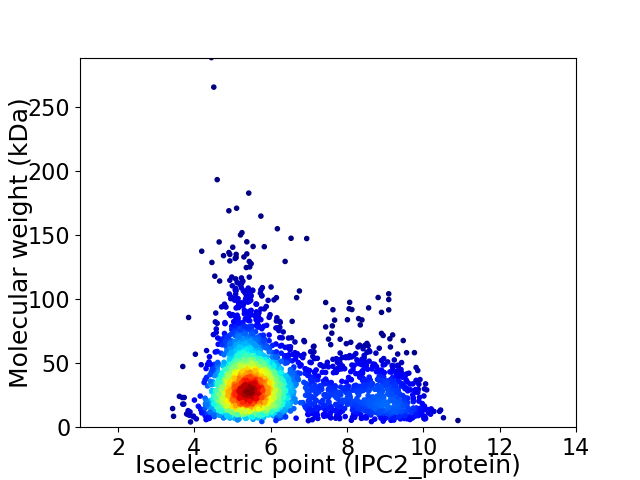
Virtual 2D-PAGE plot for 2894 proteins (isoelectric point calculated using IPC2_protein)
Get csv file with sequences according to given criteria:
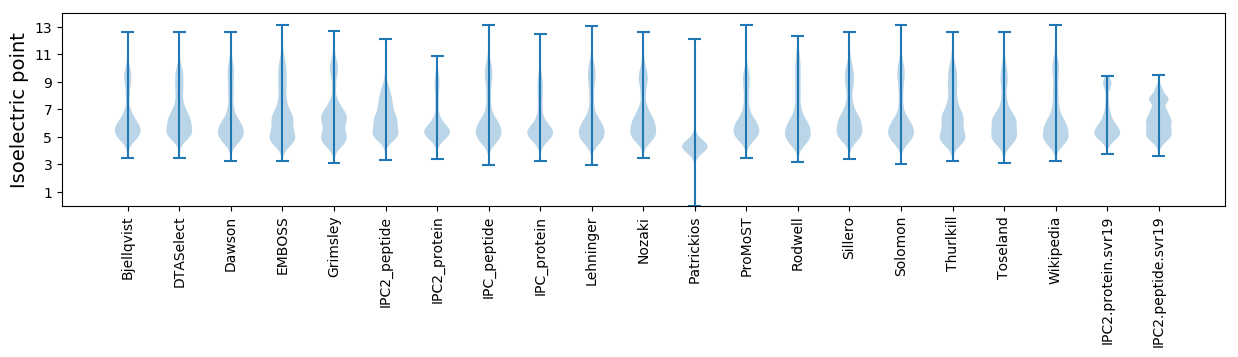
* You can choose from 21 different methods for calculating isoelectric point
Summary statistics related to proteome-wise predictions
Protein with the lowest isoelectric point:
>tr|A0A1K1YJJ5|A0A1K1YJJ5_9GAMM Lipopolysaccharide assembly protein B OS=Marinospirillum alkaliphilum DSM 21637 OX=1122209 GN=lapB PE=3 SV=1
MM1 pKa = 7.0ITEE4 pKa = 3.9QAVNQLAAYY13 pKa = 9.45IGQLPPAEE21 pKa = 3.94WDD23 pKa = 3.49DD24 pKa = 3.96RR25 pKa = 11.84LNTAFEE31 pKa = 4.2EE32 pKa = 5.07GKK34 pKa = 8.67VTLCSEE40 pKa = 3.89NDD42 pKa = 3.22IPGLAKK48 pKa = 9.93PVHH51 pKa = 5.96QGAGFDD57 pKa = 4.31LYY59 pKa = 11.47LVDD62 pKa = 5.62ASNACASLTNDD73 pKa = 3.83FSRR76 pKa = 11.84ACGVVVALHH85 pKa = 7.4DD86 pKa = 5.38DD87 pKa = 4.11DD88 pKa = 7.35DD89 pKa = 4.53DD90 pKa = 3.94
MM1 pKa = 7.0ITEE4 pKa = 3.9QAVNQLAAYY13 pKa = 9.45IGQLPPAEE21 pKa = 3.94WDD23 pKa = 3.49DD24 pKa = 3.96RR25 pKa = 11.84LNTAFEE31 pKa = 4.2EE32 pKa = 5.07GKK34 pKa = 8.67VTLCSEE40 pKa = 3.89NDD42 pKa = 3.22IPGLAKK48 pKa = 9.93PVHH51 pKa = 5.96QGAGFDD57 pKa = 4.31LYY59 pKa = 11.47LVDD62 pKa = 5.62ASNACASLTNDD73 pKa = 3.83FSRR76 pKa = 11.84ACGVVVALHH85 pKa = 7.4DD86 pKa = 5.38DD87 pKa = 4.11DD88 pKa = 7.35DD89 pKa = 4.53DD90 pKa = 3.94
Molecular weight: 9.64 kDa
Isoelectric point according different methods:
Protein with the highest isoelectric point:
>tr|A0A1K1X0V5|A0A1K1X0V5_9GAMM Sulfurtransferase OS=Marinospirillum alkaliphilum DSM 21637 OX=1122209 GN=SAMN02745752_01649 PE=4 SV=1
MM1 pKa = 7.45KK2 pKa = 9.51RR3 pKa = 11.84TFQPSVLKK11 pKa = 10.49RR12 pKa = 11.84KK13 pKa = 7.97RR14 pKa = 11.84THH16 pKa = 5.89GFRR19 pKa = 11.84ARR21 pKa = 11.84MATKK25 pKa = 10.4NGRR28 pKa = 11.84QVLARR33 pKa = 11.84RR34 pKa = 11.84RR35 pKa = 11.84AKK37 pKa = 9.97GRR39 pKa = 11.84KK40 pKa = 8.69RR41 pKa = 11.84LCAA44 pKa = 3.9
MM1 pKa = 7.45KK2 pKa = 9.51RR3 pKa = 11.84TFQPSVLKK11 pKa = 10.49RR12 pKa = 11.84KK13 pKa = 7.97RR14 pKa = 11.84THH16 pKa = 5.89GFRR19 pKa = 11.84ARR21 pKa = 11.84MATKK25 pKa = 10.4NGRR28 pKa = 11.84QVLARR33 pKa = 11.84RR34 pKa = 11.84RR35 pKa = 11.84AKK37 pKa = 9.97GRR39 pKa = 11.84KK40 pKa = 8.69RR41 pKa = 11.84LCAA44 pKa = 3.9
Molecular weight: 5.22 kDa
Isoelectric point according different methods:
Peptides (in silico digests for buttom-up proteomics)
Below you can find in silico digests of the whole proteome with Trypsin, Chymotrypsin, Trypsin+LysC, LysN, ArgC proteases suitable for different mass spec machines.| Try ESI |
 |
|---|
| ChTry ESI |
|
|---|
| ArgC ESI |
|
|---|
| LysN ESI |
|
|---|
| TryLysC ESI |
|
|---|
| Try MALDI |
|
|---|
| ChTry MALDI |
|
|---|
| ArgC MALDI |
|
|---|
| LysN MALDI |
|
|---|
| TryLysC MALDI |
|
|---|
| Try LTQ |
|
|---|
| ChTry LTQ |
|
|---|
| ArgC LTQ |
|
|---|
| LysN LTQ |
|
|---|
| TryLysC LTQ |
|
|---|
| Try MSlow |
|
|---|
| ChTry MSlow |
|
|---|
| ArgC MSlow |
|
|---|
| LysN MSlow |
|
|---|
| TryLysC MSlow |
|
|---|
| Try MShigh |
|
|---|
| ChTry MShigh |
|
|---|
| ArgC MShigh |
|
|---|
| LysN MShigh |
|
|---|
| TryLysC MShigh |
|
|---|
General Statistics
Number of major isoforms |
Number of additional isoforms |
Number of all proteins |
Number of amino acids |
Min. Seq. Length |
Max. Seq. Length |
Avg. Seq. Length |
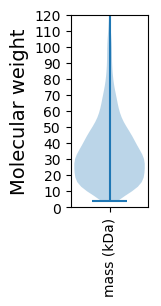
Avg. Mol. Weight |
|---|---|---|---|---|---|---|---|
0 |
963687 |
39 |
2722 |
333.0 |
36.89 |
Amino acid frequency
Ala |
Cys |
Asp |
Glu |
Phe |
Gly |
His |
Ile |
Lys |
Leu |
|---|---|---|---|---|---|---|---|---|---|
9.976 ± 0.048 | 0.947 ± 0.015 |
5.265 ± 0.034 | 6.222 ± 0.044 |
3.59 ± 0.031 | 7.336 ± 0.045 |
2.389 ± 0.023 | 4.883 ± 0.034 |
3.431 ± 0.041 | 12.612 ± 0.081 |
Met |
Asn |
Gln |
Pro |
Arg |
Ser |
Thr |
Val |
Trp |
Tyr |
|---|---|---|---|---|---|---|---|---|---|
2.472 ± 0.019 | 3.062 ± 0.034 |
4.633 ± 0.034 | 5.75 ± 0.054 |
6.367 ± 0.035 | 5.592 ± 0.037 |
4.9 ± 0.035 | 6.737 ± 0.038 |
1.414 ± 0.021 | 2.422 ± 0.021 |
Most of the basic statistics you can see at this page can be downloaded from this CSV file
See this proteome in:

Proteome-pI is available under Creative Commons Attribution-NoDerivs license, for more details see here
| Reference: Kozlowski LP. Proteome-pI 2.0: Proteome Isoelectric Point Database Update. Nucleic Acids Res. 2021, doi: 10.1093/nar/gkab944 | Contact: Lukasz P. Kozlowski |