Murmansk poxvirus
Taxonomy: Viruses; Varidnaviria; Bamfordvirae; Nucleocytoviricota; Pokkesviricetes; Chitovirales; Poxviridae; Chordopoxvirinae; Centapoxvirus; Murmansk microtuspox virus
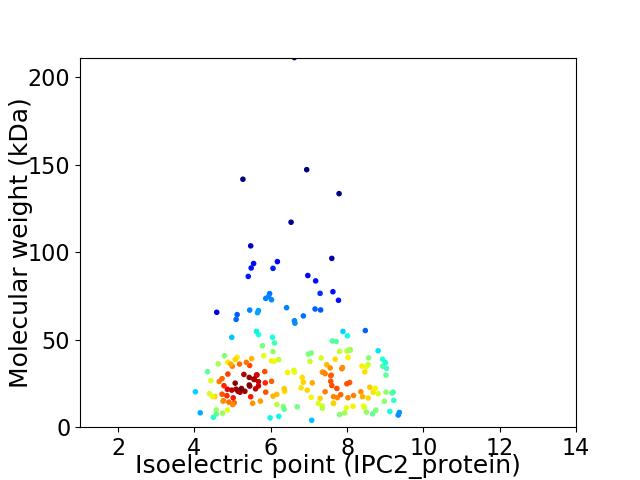
Average proteome isoelectric point is 6.56
Get precalculated fractions of proteins

Virtual 2D-PAGE plot for 202 proteins (isoelectric point calculated using IPC2_protein)
Get csv file with sequences according to given criteria:
* You can choose from 21 different methods for calculating isoelectric point
Summary statistics related to proteome-wise predictions


Protein with the lowest isoelectric point:
>tr|A0A223FMM8|A0A223FMM8_9POXV Substrate for poxvirus S-S bond formation pathway OS=Murmansk poxvirus OX=2025359 GN=Murmansk-043 PE=4 SV=1
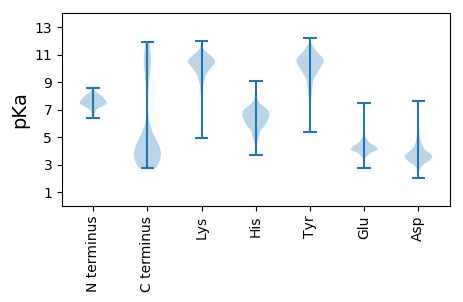
MM1 pKa = 7.74DD2 pKa = 4.31TNSLYY7 pKa = 10.95EE8 pKa = 3.85EE9 pKa = 4.75GMNISNDD16 pKa = 2.96LDD18 pKa = 4.34SIVNLLEE25 pKa = 3.75MRR27 pKa = 11.84CIDD30 pKa = 3.73SSNYY34 pKa = 8.41NDD36 pKa = 4.65KK37 pKa = 10.92YY38 pKa = 11.05LPNNFTDD45 pKa = 3.82CTYY48 pKa = 11.62KK49 pKa = 10.97LVDD52 pKa = 3.45NKK54 pKa = 10.05EE55 pKa = 3.98FKK57 pKa = 10.94YY58 pKa = 11.13VIDD61 pKa = 3.66SFINMVEE68 pKa = 3.89NDD70 pKa = 3.48NGEE73 pKa = 4.58TISSLSNFINVLKK86 pKa = 10.71NINNEE91 pKa = 3.68EE92 pKa = 4.15SVQLVEE98 pKa = 5.94FSKK101 pKa = 11.19SLNKK105 pKa = 10.3LKK107 pKa = 10.66NLSGEE112 pKa = 4.27EE113 pKa = 3.89FTSQLKK119 pKa = 10.51NIIYY123 pKa = 9.86LVKK126 pKa = 10.23EE127 pKa = 4.16DD128 pKa = 3.99TSGEE132 pKa = 4.54LITIMSNFIDD142 pKa = 3.68SCNMVKK148 pKa = 10.68YY149 pKa = 8.96ITSEE153 pKa = 4.01EE154 pKa = 4.1IEE156 pKa = 4.15NLLTDD161 pKa = 4.76FINNIDD167 pKa = 4.85DD168 pKa = 3.72IDD170 pKa = 4.35NEE172 pKa = 4.5LVVKK176 pKa = 10.67
MM1 pKa = 7.74DD2 pKa = 4.31TNSLYY7 pKa = 10.95EE8 pKa = 3.85EE9 pKa = 4.75GMNISNDD16 pKa = 2.96LDD18 pKa = 4.34SIVNLLEE25 pKa = 3.75MRR27 pKa = 11.84CIDD30 pKa = 3.73SSNYY34 pKa = 8.41NDD36 pKa = 4.65KK37 pKa = 10.92YY38 pKa = 11.05LPNNFTDD45 pKa = 3.82CTYY48 pKa = 11.62KK49 pKa = 10.97LVDD52 pKa = 3.45NKK54 pKa = 10.05EE55 pKa = 3.98FKK57 pKa = 10.94YY58 pKa = 11.13VIDD61 pKa = 3.66SFINMVEE68 pKa = 3.89NDD70 pKa = 3.48NGEE73 pKa = 4.58TISSLSNFINVLKK86 pKa = 10.71NINNEE91 pKa = 3.68EE92 pKa = 4.15SVQLVEE98 pKa = 5.94FSKK101 pKa = 11.19SLNKK105 pKa = 10.3LKK107 pKa = 10.66NLSGEE112 pKa = 4.27EE113 pKa = 3.89FTSQLKK119 pKa = 10.51NIIYY123 pKa = 9.86LVKK126 pKa = 10.23EE127 pKa = 4.16DD128 pKa = 3.99TSGEE132 pKa = 4.54LITIMSNFIDD142 pKa = 3.68SCNMVKK148 pKa = 10.68YY149 pKa = 8.96ITSEE153 pKa = 4.01EE154 pKa = 4.1IEE156 pKa = 4.15NLLTDD161 pKa = 4.76FINNIDD167 pKa = 4.85DD168 pKa = 3.72IDD170 pKa = 4.35NEE172 pKa = 4.5LVVKK176 pKa = 10.67
Molecular weight: 20.24 kDa
Isoelectric point according different methods:
Protein with the highest isoelectric point:
>tr|A0A223FMX1|A0A223FMX1_9POXV DNA helicase OS=Murmansk poxvirus OX=2025359 GN=Murmansk-134 PE=4 SV=1
MM1 pKa = 7.2SWYY4 pKa = 9.57EE5 pKa = 3.8RR6 pKa = 11.84YY7 pKa = 10.54NIVLNPPKK15 pKa = 10.29RR16 pKa = 11.84CSKK19 pKa = 10.7CNEE22 pKa = 3.94NLMTLLADD30 pKa = 4.3DD31 pKa = 4.79GNNIRR36 pKa = 11.84MILYY40 pKa = 7.99SQPNKK45 pKa = 10.7LKK47 pKa = 10.46ILRR50 pKa = 11.84DD51 pKa = 3.77FLATSRR57 pKa = 11.84NKK59 pKa = 9.45MFLYY63 pKa = 10.37KK64 pKa = 10.25ILDD67 pKa = 3.58NEE69 pKa = 4.18VRR71 pKa = 11.84RR72 pKa = 11.84VLTT75 pKa = 3.72
MM1 pKa = 7.2SWYY4 pKa = 9.57EE5 pKa = 3.8RR6 pKa = 11.84YY7 pKa = 10.54NIVLNPPKK15 pKa = 10.29RR16 pKa = 11.84CSKK19 pKa = 10.7CNEE22 pKa = 3.94NLMTLLADD30 pKa = 4.3DD31 pKa = 4.79GNNIRR36 pKa = 11.84MILYY40 pKa = 7.99SQPNKK45 pKa = 10.7LKK47 pKa = 10.46ILRR50 pKa = 11.84DD51 pKa = 3.77FLATSRR57 pKa = 11.84NKK59 pKa = 9.45MFLYY63 pKa = 10.37KK64 pKa = 10.25ILDD67 pKa = 3.58NEE69 pKa = 4.18VRR71 pKa = 11.84RR72 pKa = 11.84VLTT75 pKa = 3.72
Molecular weight: 9.0 kDa
Isoelectric point according different methods:
Peptides (in silico digests for buttom-up proteomics)
Below you can find in silico digests of the whole proteome with Trypsin, Chymotrypsin, Trypsin+LysC, LysN, ArgC proteases suitable for different mass spec machines.| Try ESI |
 |
|---|
| ChTry ESI |
 |
|---|
| ArgC ESI |
 |
|---|
| LysN ESI |
 |
|---|
| TryLysC ESI |
 |
|---|
| Try MALDI |
 |
|---|
| ChTry MALDI |
 |
|---|
| ArgC MALDI |
 |
|---|
| LysN MALDI |
 |
|---|
| TryLysC MALDI |
 |
|---|
| Try LTQ |
 |
|---|
| ChTry LTQ |
 |
|---|
| ArgC LTQ |
 |
|---|
| LysN LTQ |
 |
|---|
| TryLysC LTQ |
 |
|---|
| Try MSlow |
 |
|---|
| ChTry MSlow |
 |
|---|
| ArgC MSlow |
 |
|---|
| LysN MSlow |
 |
|---|
| TryLysC MSlow |
 |
|---|
| Try MShigh |
 |
|---|
| ChTry MShigh |
 |
|---|
| ArgC MShigh |
 |
|---|
| LysN MShigh |
 |
|---|
| TryLysC MShigh |
 |
|---|
General Statistics
Number of major isoforms |
Number of additional isoforms |
Number of all proteins |
Number of amino acids |
Min. Seq. Length |
Max. Seq. Length |
Avg. Seq. Length |
Avg. Mol. Weight |
|---|---|---|---|---|---|---|---|
0 |
62817 |
33 |
1875 |
311.0 |
35.93 |
Amino acid frequency
Ala |
Cys |
Asp |
Glu |
Phe |
Gly |
His |
Ile |
Lys |
Leu |
|---|---|---|---|---|---|---|---|---|---|
3.291 ± 0.118 | 2.135 ± 0.087 |
6.805 ± 0.145 | 5.457 ± 0.146 |
4.577 ± 0.124 | 3.884 ± 0.106 |
2.015 ± 0.067 | 10.064 ± 0.162 |
8.082 ± 0.158 | 8.555 ± 0.143 |
Met |
Asn |
Gln |
Pro |
Arg |
Ser |
Thr |
Val |
Trp |
Tyr |
|---|---|---|---|---|---|---|---|---|---|
2.566 ± 0.069 | 7.812 ± 0.168 |
3.171 ± 0.131 | 1.999 ± 0.061 |
3.911 ± 0.114 | 7.549 ± 0.154 |
5.881 ± 0.136 | 5.908 ± 0.111 |
0.708 ± 0.043 | 5.629 ± 0.157 |
Most of the basic statistics you can see at this page can be downloaded from this CSV file
Proteome-pI is available under Creative Commons Attribution-NoDerivs license, for more details see here
| Reference: Kozlowski LP. Proteome-pI 2.0: Proteome Isoelectric Point Database Update. Nucleic Acids Res. 2021, doi: 10.1093/nar/gkab944 | Contact: Lukasz P. Kozlowski |
