Thalassospira sp. HJ
Taxonomy: cellular organisms; Bacteria; Proteobacteria; Alphaproteobacteria; Rhodospirillales; Thalassospiraceae; Thalassospira; unclassified Thalassospira
Average proteome isoelectric point is 5.89
Get precalculated fractions of proteins

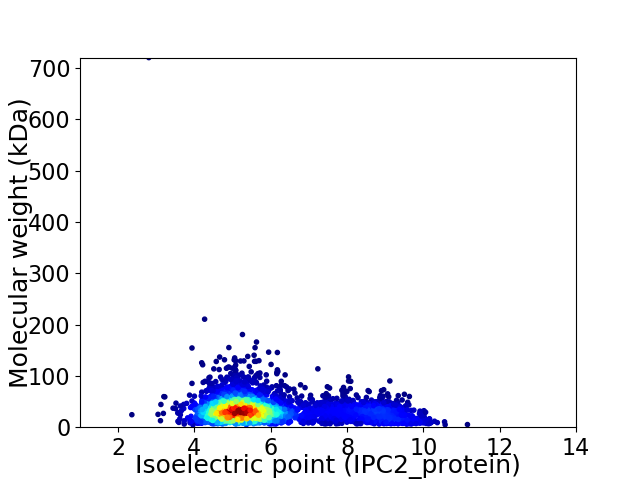
Virtual 2D-PAGE plot for 3669 proteins (isoelectric point calculated using IPC2_protein)
Get csv file with sequences according to given criteria:
* You can choose from 21 different methods for calculating isoelectric point
Summary statistics related to proteome-wise predictions


Protein with the lowest isoelectric point:
>tr|A0A0D8CFG0|A0A0D8CFG0_9PROT Cro/Cl family transcriptional regulator OS=Thalassospira sp. HJ OX=1616823 GN=UF64_09390 PE=4 SV=1
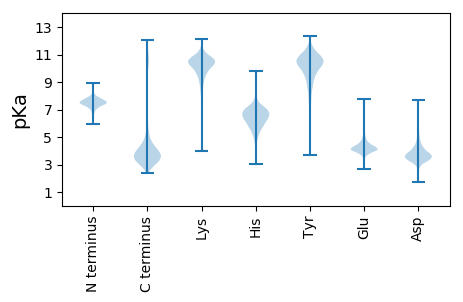
MM1 pKa = 7.46KK2 pKa = 10.18KK3 pKa = 9.81ILFASSALVAIAAAGTAQASEE24 pKa = 4.56PIKK27 pKa = 10.76LSVGGYY33 pKa = 6.95MEE35 pKa = 4.08QWAGFADD42 pKa = 3.88QDD44 pKa = 3.84QGDD47 pKa = 4.22RR48 pKa = 11.84KK49 pKa = 10.48NAFQSDD55 pKa = 4.11TEE57 pKa = 4.03IHH59 pKa = 6.45FKK61 pKa = 11.5GEE63 pKa = 3.99TTLDD67 pKa = 3.12NGIEE71 pKa = 4.02VGAVVEE77 pKa = 4.69LEE79 pKa = 4.52GEE81 pKa = 4.29TSADD85 pKa = 3.92QIDD88 pKa = 4.0EE89 pKa = 4.04QYY91 pKa = 11.25LYY93 pKa = 11.54VNGGFGQVRR102 pKa = 11.84LGKK105 pKa = 9.91DD106 pKa = 3.1DD107 pKa = 4.02SAADD111 pKa = 3.51SMGFIAPSVGPVGVNDD127 pKa = 3.8GDD129 pKa = 3.74LTNWVDD135 pKa = 3.82AYY137 pKa = 11.27LIDD140 pKa = 4.18TVPSSGDD147 pKa = 3.36QKK149 pKa = 10.83RR150 pKa = 11.84VTYY153 pKa = 6.9YY154 pKa = 9.71TPSISGFQVGVSYY167 pKa = 11.54ADD169 pKa = 4.47DD170 pKa = 5.03DD171 pKa = 4.61GSNNNDD177 pKa = 3.36TANDD181 pKa = 3.54GDD183 pKa = 4.53NIVSAGINYY192 pKa = 9.64QGEE195 pKa = 4.24FDD197 pKa = 3.9GVSVGVSATGEE208 pKa = 3.82NWGEE212 pKa = 4.13GNWYY216 pKa = 10.47GLGATVGFGNFVVGSSWGHH235 pKa = 6.9IEE237 pKa = 5.38DD238 pKa = 6.12DD239 pKa = 3.88YY240 pKa = 12.09AQDD243 pKa = 3.26EE244 pKa = 4.69GSRR247 pKa = 11.84TGGDD251 pKa = 2.77TDD253 pKa = 4.08AFDD256 pKa = 3.88IGVSYY261 pKa = 11.35AMDD264 pKa = 4.32AATVSLSYY272 pKa = 10.93GYY274 pKa = 10.91AEE276 pKa = 4.19YY277 pKa = 11.2GNRR280 pKa = 11.84DD281 pKa = 2.95VDD283 pKa = 4.16LTDD286 pKa = 5.5DD287 pKa = 4.87DD288 pKa = 4.83VDD290 pKa = 4.11LSGTGEE296 pKa = 4.03ISTVDD301 pKa = 3.43LGLSYY306 pKa = 10.78TLGAGVAWRR315 pKa = 11.84SSIFWFDD322 pKa = 4.18DD323 pKa = 3.64EE324 pKa = 5.26SDD326 pKa = 3.54NAAIADD332 pKa = 3.75NDD334 pKa = 3.73GFGAVTGLALTFF346 pKa = 4.31
MM1 pKa = 7.46KK2 pKa = 10.18KK3 pKa = 9.81ILFASSALVAIAAAGTAQASEE24 pKa = 4.56PIKK27 pKa = 10.76LSVGGYY33 pKa = 6.95MEE35 pKa = 4.08QWAGFADD42 pKa = 3.88QDD44 pKa = 3.84QGDD47 pKa = 4.22RR48 pKa = 11.84KK49 pKa = 10.48NAFQSDD55 pKa = 4.11TEE57 pKa = 4.03IHH59 pKa = 6.45FKK61 pKa = 11.5GEE63 pKa = 3.99TTLDD67 pKa = 3.12NGIEE71 pKa = 4.02VGAVVEE77 pKa = 4.69LEE79 pKa = 4.52GEE81 pKa = 4.29TSADD85 pKa = 3.92QIDD88 pKa = 4.0EE89 pKa = 4.04QYY91 pKa = 11.25LYY93 pKa = 11.54VNGGFGQVRR102 pKa = 11.84LGKK105 pKa = 9.91DD106 pKa = 3.1DD107 pKa = 4.02SAADD111 pKa = 3.51SMGFIAPSVGPVGVNDD127 pKa = 3.8GDD129 pKa = 3.74LTNWVDD135 pKa = 3.82AYY137 pKa = 11.27LIDD140 pKa = 4.18TVPSSGDD147 pKa = 3.36QKK149 pKa = 10.83RR150 pKa = 11.84VTYY153 pKa = 6.9YY154 pKa = 9.71TPSISGFQVGVSYY167 pKa = 11.54ADD169 pKa = 4.47DD170 pKa = 5.03DD171 pKa = 4.61GSNNNDD177 pKa = 3.36TANDD181 pKa = 3.54GDD183 pKa = 4.53NIVSAGINYY192 pKa = 9.64QGEE195 pKa = 4.24FDD197 pKa = 3.9GVSVGVSATGEE208 pKa = 3.82NWGEE212 pKa = 4.13GNWYY216 pKa = 10.47GLGATVGFGNFVVGSSWGHH235 pKa = 6.9IEE237 pKa = 5.38DD238 pKa = 6.12DD239 pKa = 3.88YY240 pKa = 12.09AQDD243 pKa = 3.26EE244 pKa = 4.69GSRR247 pKa = 11.84TGGDD251 pKa = 2.77TDD253 pKa = 4.08AFDD256 pKa = 3.88IGVSYY261 pKa = 11.35AMDD264 pKa = 4.32AATVSLSYY272 pKa = 10.93GYY274 pKa = 10.91AEE276 pKa = 4.19YY277 pKa = 11.2GNRR280 pKa = 11.84DD281 pKa = 2.95VDD283 pKa = 4.16LTDD286 pKa = 5.5DD287 pKa = 4.87DD288 pKa = 4.83VDD290 pKa = 4.11LSGTGEE296 pKa = 4.03ISTVDD301 pKa = 3.43LGLSYY306 pKa = 10.78TLGAGVAWRR315 pKa = 11.84SSIFWFDD322 pKa = 4.18DD323 pKa = 3.64EE324 pKa = 5.26SDD326 pKa = 3.54NAAIADD332 pKa = 3.75NDD334 pKa = 3.73GFGAVTGLALTFF346 pKa = 4.31
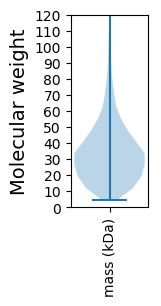
Molecular weight: 36.23 kDa
Isoelectric point according different methods:
Protein with the highest isoelectric point:
>tr|A0A0D8CK23|A0A0D8CK23_9PROT Signal peptidase I OS=Thalassospira sp. HJ OX=1616823 GN=UF64_00745 PE=3 SV=1
MM1 pKa = 7.35KK2 pKa = 9.43RR3 pKa = 11.84TYY5 pKa = 10.27QPSKK9 pKa = 9.73LVRR12 pKa = 11.84KK13 pKa = 8.95RR14 pKa = 11.84RR15 pKa = 11.84HH16 pKa = 4.64GFRR19 pKa = 11.84SRR21 pKa = 11.84SATVGGRR28 pKa = 11.84RR29 pKa = 11.84VLTARR34 pKa = 11.84RR35 pKa = 11.84AKK37 pKa = 9.82GRR39 pKa = 11.84KK40 pKa = 8.91RR41 pKa = 11.84LSAA44 pKa = 3.96
MM1 pKa = 7.35KK2 pKa = 9.43RR3 pKa = 11.84TYY5 pKa = 10.27QPSKK9 pKa = 9.73LVRR12 pKa = 11.84KK13 pKa = 8.95RR14 pKa = 11.84RR15 pKa = 11.84HH16 pKa = 4.64GFRR19 pKa = 11.84SRR21 pKa = 11.84SATVGGRR28 pKa = 11.84RR29 pKa = 11.84VLTARR34 pKa = 11.84RR35 pKa = 11.84AKK37 pKa = 9.82GRR39 pKa = 11.84KK40 pKa = 8.91RR41 pKa = 11.84LSAA44 pKa = 3.96
Molecular weight: 5.14 kDa
Isoelectric point according different methods:
Peptides (in silico digests for buttom-up proteomics)
Below you can find in silico digests of the whole proteome with Trypsin, Chymotrypsin, Trypsin+LysC, LysN, ArgC proteases suitable for different mass spec machines.| Try ESI |
 |
|---|
| ChTry ESI |
 |
|---|
| ArgC ESI |
 |
|---|
| LysN ESI |
 |
|---|
| TryLysC ESI |
 |
|---|
| Try MALDI |
 |
|---|
| ChTry MALDI |
 |
|---|
| ArgC MALDI |
 |
|---|
| LysN MALDI |
 |
|---|
| TryLysC MALDI |
 |
|---|
| Try LTQ |
 |
|---|
| ChTry LTQ |
 |
|---|
| ArgC LTQ |
 |
|---|
| LysN LTQ |
 |
|---|
| TryLysC LTQ |
 |
|---|
| Try MSlow |
 |
|---|
| ChTry MSlow |
 |
|---|
| ArgC MSlow |
 |
|---|
| LysN MSlow |
 |
|---|
| TryLysC MSlow |
 |
|---|
| Try MShigh |
 |
|---|
| ChTry MShigh |
 |
|---|
| ArgC MShigh |
 |
|---|
| LysN MShigh |
 |
|---|
| TryLysC MShigh |
 |
|---|
General Statistics
Number of major isoforms |
Number of additional isoforms |
Number of all proteins |
Number of amino acids |
Min. Seq. Length |
Max. Seq. Length |
Avg. Seq. Length |
Avg. Mol. Weight |
|---|---|---|---|---|---|---|---|
0 |
1179098 |
41 |
7388 |
321.4 |
35.13 |
Amino acid frequency
Ala |
Cys |
Asp |
Glu |
Phe |
Gly |
His |
Ile |
Lys |
Leu |
|---|---|---|---|---|---|---|---|---|---|
10.718 ± 0.048 | 0.938 ± 0.011 |
6.466 ± 0.071 | 6.137 ± 0.039 |
3.924 ± 0.03 | 8.258 ± 0.085 |
2.078 ± 0.023 | 5.982 ± 0.027 |
4.144 ± 0.039 | 9.676 ± 0.047 |
Met |
Asn |
Gln |
Pro |
Arg |
Ser |
Thr |
Val |
Trp |
Tyr |
|---|---|---|---|---|---|---|---|---|---|
2.803 ± 0.022 | 3.287 ± 0.029 |
4.548 ± 0.033 | 3.187 ± 0.03 |
5.852 ± 0.046 | 5.67 ± 0.033 |
5.39 ± 0.035 | 7.29 ± 0.035 |
1.231 ± 0.018 | 2.422 ± 0.022 |
Most of the basic statistics you can see at this page can be downloaded from this CSV file
Proteome-pI is available under Creative Commons Attribution-NoDerivs license, for more details see here
| Reference: Kozlowski LP. Proteome-pI 2.0: Proteome Isoelectric Point Database Update. Nucleic Acids Res. 2021, doi: 10.1093/nar/gkab944 | Contact: Lukasz P. Kozlowski |
