Granulicella rosea
Taxonomy: cellular organisms; Bacteria; Acidobacteria; Acidobacteriia; Acidobacteriales; Acidobacteriaceae; Granulicella
Average proteome isoelectric point is 6.61
Get precalculated fractions of proteins

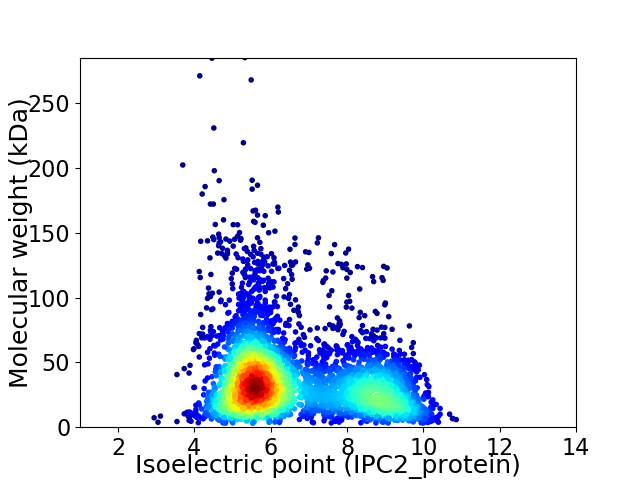
Virtual 2D-PAGE plot for 4295 proteins (isoelectric point calculated using IPC2_protein)
Get csv file with sequences according to given criteria:
* You can choose from 21 different methods for calculating isoelectric point
Summary statistics related to proteome-wise predictions


Protein with the lowest isoelectric point:
>tr|A0A239IYM9|A0A239IYM9_9BACT Isoamylase OS=Granulicella rosea OX=474952 GN=SAMN05421770_103335 PE=3 SV=1
MM1 pKa = 7.68SLGILNNIAAIYY13 pKa = 8.99AQNNLNQTQASLQTTLNQLSSGSRR37 pKa = 11.84INSGADD43 pKa = 3.18DD44 pKa = 4.1AAGLAVVDD52 pKa = 4.15GLGANIAALTQSSQNATDD70 pKa = 5.57GIGLLQTADD79 pKa = 3.52GALSQVTNLLDD90 pKa = 3.64RR91 pKa = 11.84AVTLSTEE98 pKa = 4.17AANGTLNSNQVSSANQEE115 pKa = 3.94YY116 pKa = 10.9QNILNEE122 pKa = 4.19IGDD125 pKa = 3.72IGTTTNFNSNSVFSNIANTVFVSDD149 pKa = 4.03GTGSGANVYY158 pKa = 10.72SDD160 pKa = 3.04IVGVLSKK167 pKa = 11.47SNVGQSAPVGAGVALTSGTATTSSLTVGSSVTFSALTNYY206 pKa = 10.39NDD208 pKa = 4.33TIAGTLSVSVAGGTAINSTIATGTSLTDD236 pKa = 4.27AVNQLNDD243 pKa = 3.31QYY245 pKa = 11.53NADD248 pKa = 3.44GSGIVASIGSGNKK261 pKa = 9.45LVLTGPEE268 pKa = 3.99DD269 pKa = 4.41AEE271 pKa = 4.21NTTAGTNVLAVSTNTLEE288 pKa = 4.93DD289 pKa = 3.81YY290 pKa = 11.24APAAAGATAGAGIDD304 pKa = 3.88FTNSDD309 pKa = 4.02VSTLTQSSAQTVLTTVTSAIAGVAYY334 pKa = 10.03QRR336 pKa = 11.84GIIGADD342 pKa = 2.97INQLTAASNVASAEE356 pKa = 4.18SEE358 pKa = 4.15NLTSAQSSIQSTNYY372 pKa = 9.61GQATSDD378 pKa = 3.47LAKK381 pKa = 10.71YY382 pKa = 9.63QVLSQTGISALAQANSVQQEE402 pKa = 4.33VLKK405 pKa = 10.92LLQQ408 pKa = 3.71
MM1 pKa = 7.68SLGILNNIAAIYY13 pKa = 8.99AQNNLNQTQASLQTTLNQLSSGSRR37 pKa = 11.84INSGADD43 pKa = 3.18DD44 pKa = 4.1AAGLAVVDD52 pKa = 4.15GLGANIAALTQSSQNATDD70 pKa = 5.57GIGLLQTADD79 pKa = 3.52GALSQVTNLLDD90 pKa = 3.64RR91 pKa = 11.84AVTLSTEE98 pKa = 4.17AANGTLNSNQVSSANQEE115 pKa = 3.94YY116 pKa = 10.9QNILNEE122 pKa = 4.19IGDD125 pKa = 3.72IGTTTNFNSNSVFSNIANTVFVSDD149 pKa = 4.03GTGSGANVYY158 pKa = 10.72SDD160 pKa = 3.04IVGVLSKK167 pKa = 11.47SNVGQSAPVGAGVALTSGTATTSSLTVGSSVTFSALTNYY206 pKa = 10.39NDD208 pKa = 4.33TIAGTLSVSVAGGTAINSTIATGTSLTDD236 pKa = 4.27AVNQLNDD243 pKa = 3.31QYY245 pKa = 11.53NADD248 pKa = 3.44GSGIVASIGSGNKK261 pKa = 9.45LVLTGPEE268 pKa = 3.99DD269 pKa = 4.41AEE271 pKa = 4.21NTTAGTNVLAVSTNTLEE288 pKa = 4.93DD289 pKa = 3.81YY290 pKa = 11.24APAAAGATAGAGIDD304 pKa = 3.88FTNSDD309 pKa = 4.02VSTLTQSSAQTVLTTVTSAIAGVAYY334 pKa = 10.03QRR336 pKa = 11.84GIIGADD342 pKa = 2.97INQLTAASNVASAEE356 pKa = 4.18SEE358 pKa = 4.15NLTSAQSSIQSTNYY372 pKa = 9.61GQATSDD378 pKa = 3.47LAKK381 pKa = 10.71YY382 pKa = 9.63QVLSQTGISALAQANSVQQEE402 pKa = 4.33VLKK405 pKa = 10.92LLQQ408 pKa = 3.71
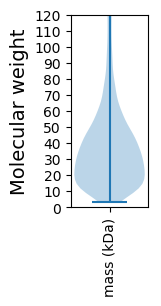
Molecular weight: 40.65 kDa
Isoelectric point according different methods:
Protein with the highest isoelectric point:
>tr|A0A239DWU5|A0A239DWU5_9BACT Cytidine deaminase OS=Granulicella rosea OX=474952 GN=SAMN05421770_101689 PE=3 SV=1
MM1 pKa = 8.0PKK3 pKa = 9.02RR4 pKa = 11.84TFQPNRR10 pKa = 11.84RR11 pKa = 11.84HH12 pKa = 5.69RR13 pKa = 11.84AKK15 pKa = 9.55THH17 pKa = 5.53GFLSRR22 pKa = 11.84MKK24 pKa = 8.98TKK26 pKa = 10.79AGAAVLNRR34 pKa = 11.84RR35 pKa = 11.84RR36 pKa = 11.84AKK38 pKa = 10.03GRR40 pKa = 11.84HH41 pKa = 5.72KK42 pKa = 10.29IAVSAGFRR50 pKa = 11.84DD51 pKa = 3.66
MM1 pKa = 8.0PKK3 pKa = 9.02RR4 pKa = 11.84TFQPNRR10 pKa = 11.84RR11 pKa = 11.84HH12 pKa = 5.69RR13 pKa = 11.84AKK15 pKa = 9.55THH17 pKa = 5.53GFLSRR22 pKa = 11.84MKK24 pKa = 8.98TKK26 pKa = 10.79AGAAVLNRR34 pKa = 11.84RR35 pKa = 11.84RR36 pKa = 11.84AKK38 pKa = 10.03GRR40 pKa = 11.84HH41 pKa = 5.72KK42 pKa = 10.29IAVSAGFRR50 pKa = 11.84DD51 pKa = 3.66
Molecular weight: 5.87 kDa
Isoelectric point according different methods:
Peptides (in silico digests for buttom-up proteomics)
Below you can find in silico digests of the whole proteome with Trypsin, Chymotrypsin, Trypsin+LysC, LysN, ArgC proteases suitable for different mass spec machines.| Try ESI |
 |
|---|
| ChTry ESI |
 |
|---|
| ArgC ESI |
 |
|---|
| LysN ESI |
 |
|---|
| TryLysC ESI |
 |
|---|
| Try MALDI |
 |
|---|
| ChTry MALDI |
 |
|---|
| ArgC MALDI |
 |
|---|
| LysN MALDI |
 |
|---|
| TryLysC MALDI |
 |
|---|
| Try LTQ |
 |
|---|
| ChTry LTQ |
 |
|---|
| ArgC LTQ |
 |
|---|
| LysN LTQ |
 |
|---|
| TryLysC LTQ |
 |
|---|
| Try MSlow |
 |
|---|
| ChTry MSlow |
 |
|---|
| ArgC MSlow |
 |
|---|
| LysN MSlow |
 |
|---|
| TryLysC MSlow |
 |
|---|
| Try MShigh |
 |
|---|
| ChTry MShigh |
 |
|---|
| ArgC MShigh |
 |
|---|
| LysN MShigh |
 |
|---|
| TryLysC MShigh |
 |
|---|
General Statistics
Number of major isoforms |
Number of additional isoforms |
Number of all proteins |
Number of amino acids |
Min. Seq. Length |
Max. Seq. Length |
Avg. Seq. Length |
Avg. Mol. Weight |
|---|---|---|---|---|---|---|---|
0 |
1567266 |
28 |
2848 |
364.9 |
39.54 |
Amino acid frequency
Ala |
Cys |
Asp |
Glu |
Phe |
Gly |
His |
Ile |
Lys |
Leu |
|---|---|---|---|---|---|---|---|---|---|
11.702 ± 0.05 | 0.851 ± 0.012 |
5.017 ± 0.03 | 5.173 ± 0.046 |
3.738 ± 0.022 | 8.249 ± 0.044 |
2.183 ± 0.019 | 4.848 ± 0.027 |
3.535 ± 0.034 | 9.963 ± 0.049 |
Met |
Asn |
Gln |
Pro |
Arg |
Ser |
Thr |
Val |
Trp |
Tyr |
|---|---|---|---|---|---|---|---|---|---|
2.204 ± 0.021 | 3.325 ± 0.032 |
5.473 ± 0.029 | 3.698 ± 0.027 |
5.895 ± 0.049 | 6.253 ± 0.038 |
6.572 ± 0.061 | 7.227 ± 0.029 |
1.294 ± 0.016 | 2.8 ± 0.022 |
Most of the basic statistics you can see at this page can be downloaded from this CSV file
Proteome-pI is available under Creative Commons Attribution-NoDerivs license, for more details see here
| Reference: Kozlowski LP. Proteome-pI 2.0: Proteome Isoelectric Point Database Update. Nucleic Acids Res. 2021, doi: 10.1093/nar/gkab944 | Contact: Lukasz P. Kozlowski |
