Hydrogenophaga sp. IBVHS1
Taxonomy: cellular organisms; Bacteria; Proteobacteria; Betaproteobacteria; Burkholderiales; Comamonadaceae; Hydrogenophaga; unclassified Hydrogenophaga
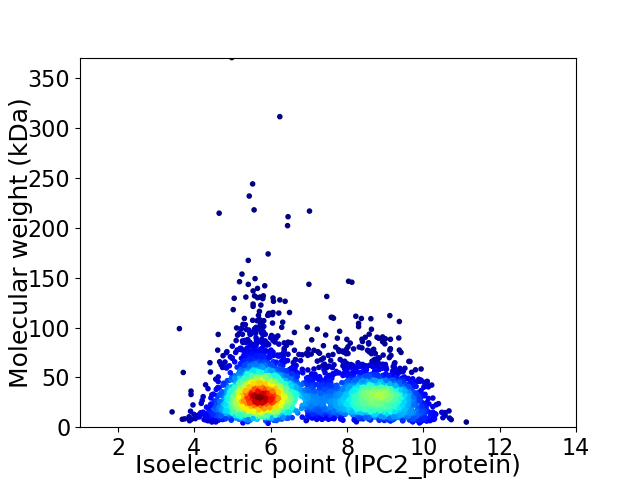
Average proteome isoelectric point is 6.91
Get precalculated fractions of proteins

Virtual 2D-PAGE plot for 4193 proteins (isoelectric point calculated using IPC2_protein)
Get csv file with sequences according to given criteria:
* You can choose from 21 different methods for calculating isoelectric point
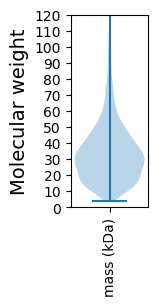
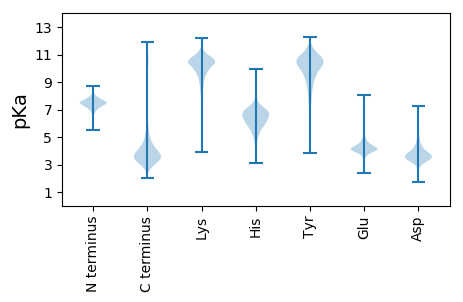
Summary statistics related to proteome-wise predictions


Protein with the lowest isoelectric point:
>tr|A0A1Y2R020|A0A1Y2R020_9BURK AI-2E family transporter OS=Hydrogenophaga sp. IBVHS1 OX=1985169 GN=CAP37_15745 PE=3 SV=1
MM1 pKa = 7.24KK2 pKa = 9.99HH3 pKa = 5.51QLIMMGLTLALTACGGGGDD22 pKa = 4.04EE23 pKa = 4.62MGEE26 pKa = 4.19GAPLQAQGLDD36 pKa = 3.03LAYY39 pKa = 10.38AVNTFDD45 pKa = 3.67HH46 pKa = 6.9TISSFTANGATGALSAVGPALPTGSGPAAVGVHH79 pKa = 5.05PAGRR83 pKa = 11.84FVYY86 pKa = 9.9VANFGGDD93 pKa = 3.36SVSAYY98 pKa = 10.46SVAINDD104 pKa = 4.09GALTPVGEE112 pKa = 4.67FAAGDD117 pKa = 3.95GPRR120 pKa = 11.84SVTVSRR126 pKa = 11.84DD127 pKa = 2.87GRR129 pKa = 11.84FVYY132 pKa = 10.14VANDD136 pKa = 3.44LSDD139 pKa = 4.74DD140 pKa = 3.64VSTYY144 pKa = 10.96AINAATGALNAVGLAVATGTNPRR167 pKa = 11.84SVVVDD172 pKa = 3.73PQTRR176 pKa = 11.84FAWVANLLSDD186 pKa = 3.83SVSAYY191 pKa = 9.24TINALTGALSPIGVPVAAGDD211 pKa = 3.88GPTALGIDD219 pKa = 3.45PTGRR223 pKa = 11.84FAYY226 pKa = 9.94VVNTNDD232 pKa = 3.56DD233 pKa = 3.97TVVSYY238 pKa = 10.97AIDD241 pKa = 3.64AVTGALSPLGAPVATGDD258 pKa = 3.14APAAVRR264 pKa = 11.84VHH266 pKa = 6.98PGGHH270 pKa = 5.36WLYY273 pKa = 10.69VANRR277 pKa = 11.84LSDD280 pKa = 3.87DD281 pKa = 3.65VSVYY285 pKa = 10.86AIDD288 pKa = 4.0PVSGQLSAVGVPVTAGDD305 pKa = 4.57GPQSMGVSPDD315 pKa = 2.68GRR317 pKa = 11.84FAYY320 pKa = 9.82VANATSDD327 pKa = 4.01DD328 pKa = 3.82VSSYY332 pKa = 11.27AIDD335 pKa = 3.96AGSGALIAVGPPAPAGDD352 pKa = 3.98GPVGIDD358 pKa = 3.32ATNTSLLLQQ367 pKa = 3.98
MM1 pKa = 7.24KK2 pKa = 9.99HH3 pKa = 5.51QLIMMGLTLALTACGGGGDD22 pKa = 4.04EE23 pKa = 4.62MGEE26 pKa = 4.19GAPLQAQGLDD36 pKa = 3.03LAYY39 pKa = 10.38AVNTFDD45 pKa = 3.67HH46 pKa = 6.9TISSFTANGATGALSAVGPALPTGSGPAAVGVHH79 pKa = 5.05PAGRR83 pKa = 11.84FVYY86 pKa = 9.9VANFGGDD93 pKa = 3.36SVSAYY98 pKa = 10.46SVAINDD104 pKa = 4.09GALTPVGEE112 pKa = 4.67FAAGDD117 pKa = 3.95GPRR120 pKa = 11.84SVTVSRR126 pKa = 11.84DD127 pKa = 2.87GRR129 pKa = 11.84FVYY132 pKa = 10.14VANDD136 pKa = 3.44LSDD139 pKa = 4.74DD140 pKa = 3.64VSTYY144 pKa = 10.96AINAATGALNAVGLAVATGTNPRR167 pKa = 11.84SVVVDD172 pKa = 3.73PQTRR176 pKa = 11.84FAWVANLLSDD186 pKa = 3.83SVSAYY191 pKa = 9.24TINALTGALSPIGVPVAAGDD211 pKa = 3.88GPTALGIDD219 pKa = 3.45PTGRR223 pKa = 11.84FAYY226 pKa = 9.94VVNTNDD232 pKa = 3.56DD233 pKa = 3.97TVVSYY238 pKa = 10.97AIDD241 pKa = 3.64AVTGALSPLGAPVATGDD258 pKa = 3.14APAAVRR264 pKa = 11.84VHH266 pKa = 6.98PGGHH270 pKa = 5.36WLYY273 pKa = 10.69VANRR277 pKa = 11.84LSDD280 pKa = 3.87DD281 pKa = 3.65VSVYY285 pKa = 10.86AIDD288 pKa = 4.0PVSGQLSAVGVPVTAGDD305 pKa = 4.57GPQSMGVSPDD315 pKa = 2.68GRR317 pKa = 11.84FAYY320 pKa = 9.82VANATSDD327 pKa = 4.01DD328 pKa = 3.82VSSYY332 pKa = 11.27AIDD335 pKa = 3.96AGSGALIAVGPPAPAGDD352 pKa = 3.98GPVGIDD358 pKa = 3.32ATNTSLLLQQ367 pKa = 3.98
Molecular weight: 36.22 kDa
Isoelectric point according different methods:
Protein with the highest isoelectric point:
>tr|A0A1Y2QSY2|A0A1Y2QSY2_9BURK Lysine transporter LysE OS=Hydrogenophaga sp. IBVHS1 OX=1985169 GN=CAP37_20060 PE=4 SV=1
MM1 pKa = 7.35KK2 pKa = 9.43RR3 pKa = 11.84TYY5 pKa = 10.07QPSKK9 pKa = 9.07IRR11 pKa = 11.84RR12 pKa = 11.84ARR14 pKa = 11.84THH16 pKa = 5.91GFLVRR21 pKa = 11.84MKK23 pKa = 9.7TRR25 pKa = 11.84GGRR28 pKa = 11.84AVINARR34 pKa = 11.84RR35 pKa = 11.84AKK37 pKa = 9.58GRR39 pKa = 11.84KK40 pKa = 8.75RR41 pKa = 11.84LAVV44 pKa = 3.41
MM1 pKa = 7.35KK2 pKa = 9.43RR3 pKa = 11.84TYY5 pKa = 10.07QPSKK9 pKa = 9.07IRR11 pKa = 11.84RR12 pKa = 11.84ARR14 pKa = 11.84THH16 pKa = 5.91GFLVRR21 pKa = 11.84MKK23 pKa = 9.7TRR25 pKa = 11.84GGRR28 pKa = 11.84AVINARR34 pKa = 11.84RR35 pKa = 11.84AKK37 pKa = 9.58GRR39 pKa = 11.84KK40 pKa = 8.75RR41 pKa = 11.84LAVV44 pKa = 3.41
Molecular weight: 5.15 kDa
Isoelectric point according different methods:
Peptides (in silico digests for buttom-up proteomics)
Below you can find in silico digests of the whole proteome with Trypsin, Chymotrypsin, Trypsin+LysC, LysN, ArgC proteases suitable for different mass spec machines.| Try ESI |
 |
|---|
| ChTry ESI |
 |
|---|
| ArgC ESI |
 |
|---|
| LysN ESI |
 |
|---|
| TryLysC ESI |
 |
|---|
| Try MALDI |
 |
|---|
| ChTry MALDI |
 |
|---|
| ArgC MALDI |
 |
|---|
| LysN MALDI |
 |
|---|
| TryLysC MALDI |
 |
|---|
| Try LTQ |
 |
|---|
| ChTry LTQ |
 |
|---|
| ArgC LTQ |
 |
|---|
| LysN LTQ |
 |
|---|
| TryLysC LTQ |
 |
|---|
| Try MSlow |
 |
|---|
| ChTry MSlow |
 |
|---|
| ArgC MSlow |
 |
|---|
| LysN MSlow |
 |
|---|
| TryLysC MSlow |
 |
|---|
| Try MShigh |
 |
|---|
| ChTry MShigh |
 |
|---|
| ArgC MShigh |
 |
|---|
| LysN MShigh |
 |
|---|
| TryLysC MShigh |
 |
|---|
General Statistics
Number of major isoforms |
Number of additional isoforms |
Number of all proteins |
Number of amino acids |
Min. Seq. Length |
Max. Seq. Length |
Avg. Seq. Length |
Avg. Mol. Weight |
|---|---|---|---|---|---|---|---|
0 |
1365467 |
37 |
3571 |
325.7 |
35.38 |
Amino acid frequency
Ala |
Cys |
Asp |
Glu |
Phe |
Gly |
His |
Ile |
Lys |
Leu |
|---|---|---|---|---|---|---|---|---|---|
12.484 ± 0.049 | 0.932 ± 0.012 |
5.045 ± 0.029 | 5.346 ± 0.035 |
3.556 ± 0.024 | 8.365 ± 0.028 |
2.389 ± 0.02 | 4.201 ± 0.031 |
3.165 ± 0.033 | 10.929 ± 0.051 |
Met |
Asn |
Gln |
Pro |
Arg |
Ser |
Thr |
Val |
Trp |
Tyr |
|---|---|---|---|---|---|---|---|---|---|
2.64 ± 0.021 | 2.576 ± 0.019 |
5.34 ± 0.028 | 3.985 ± 0.025 |
6.917 ± 0.033 | 5.397 ± 0.022 |
5.23 ± 0.021 | 7.852 ± 0.029 |
1.565 ± 0.019 | 2.085 ± 0.018 |
Most of the basic statistics you can see at this page can be downloaded from this CSV file
Proteome-pI is available under Creative Commons Attribution-NoDerivs license, for more details see here
| Reference: Kozlowski LP. Proteome-pI 2.0: Proteome Isoelectric Point Database Update. Nucleic Acids Res. 2021, doi: 10.1093/nar/gkab944 | Contact: Lukasz P. Kozlowski |
