Monosporascus ibericus
Taxonomy: cellular organisms; Eukaryota; Opisthokonta; Fungi; Dikarya; Ascomycota; saccharomyceta; Pezizomycotina; leotiomyceta; sordariomyceta; Sordariomycetes; Xylariomycetidae; Xylariales; Xylariales incertae sedis; Monosporascus
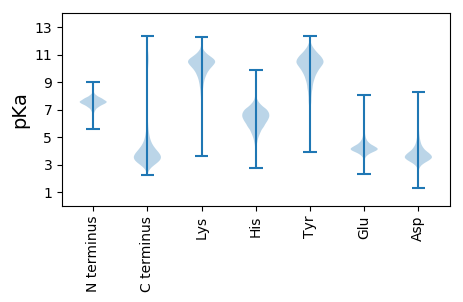
Average proteome isoelectric point is 6.41
Get precalculated fractions of proteins

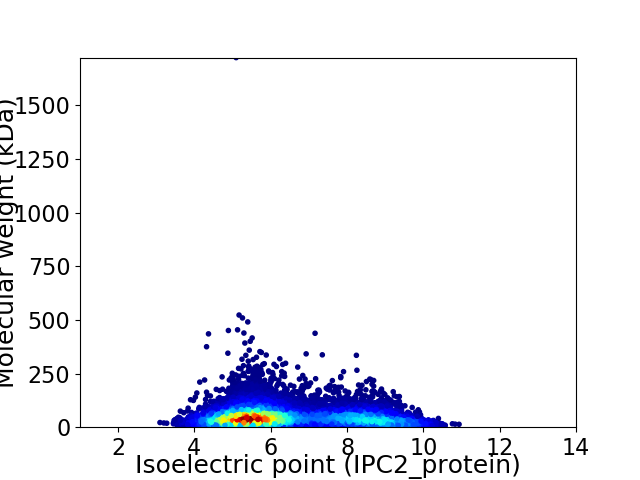
Virtual 2D-PAGE plot for 11059 proteins (isoelectric point calculated using IPC2_protein)
Get csv file with sequences according to given criteria:
* You can choose from 21 different methods for calculating isoelectric point
Summary statistics related to proteome-wise predictions


Protein with the lowest isoelectric point:
>tr|A0A4Q4SRJ8|A0A4Q4SRJ8_9PEZI FMN hydroxy acid dehydrogenase domain-containing protein OS=Monosporascus ibericus OX=155417 GN=DL764_011043 PE=3 SV=1
MM1 pKa = 7.83HH2 pKa = 6.65YY3 pKa = 7.03TTASFLAVLGLASAQRR19 pKa = 11.84LHH21 pKa = 6.01VVSVSGEE28 pKa = 3.98GDD30 pKa = 3.0WALKK34 pKa = 10.01FSPDD38 pKa = 3.64NIKK41 pKa = 10.65VPVGDD46 pKa = 4.19MIQFQFRR53 pKa = 11.84AGNHH57 pKa = 5.33SVVQSNFDD65 pKa = 3.78NPCEE69 pKa = 4.27PIKK72 pKa = 10.27MHH74 pKa = 6.55TGAEE78 pKa = 4.33GFYY81 pKa = 10.58SGYY84 pKa = 10.22QLVAASEE91 pKa = 4.16EE92 pKa = 4.03MDD94 pKa = 5.55LIPTYY99 pKa = 10.56TVMVQDD105 pKa = 4.81EE106 pKa = 4.75SPMWVYY112 pKa = 10.76CSQGQHH118 pKa = 5.89CQNGMVMVVNEE129 pKa = 3.88NTAANSSRR137 pKa = 11.84SLEE140 pKa = 4.11EE141 pKa = 3.78YY142 pKa = 10.61RR143 pKa = 11.84NLAAEE148 pKa = 4.63APDD151 pKa = 3.81NLAGDD156 pKa = 3.84VEE158 pKa = 4.95GIGGEE163 pKa = 4.24TGTTPEE169 pKa = 3.97PTEE172 pKa = 4.77PGDD175 pKa = 3.72EE176 pKa = 4.02TDD178 pKa = 3.94APSDD182 pKa = 3.81EE183 pKa = 4.63EE184 pKa = 4.58TPATPGDD191 pKa = 4.28DD192 pKa = 3.72DD193 pKa = 4.21TTTGDD198 pKa = 3.86DD199 pKa = 3.56TTGDD203 pKa = 3.54EE204 pKa = 4.46TLTPGSDD211 pKa = 3.15ATPTEE216 pKa = 4.31TADD219 pKa = 3.52GAASGTEE226 pKa = 3.96AADD229 pKa = 3.6EE230 pKa = 4.58ASTSVAQVGGGSMVTVTSPMGFFALAAAFFMLL262 pKa = 5.12
MM1 pKa = 7.83HH2 pKa = 6.65YY3 pKa = 7.03TTASFLAVLGLASAQRR19 pKa = 11.84LHH21 pKa = 6.01VVSVSGEE28 pKa = 3.98GDD30 pKa = 3.0WALKK34 pKa = 10.01FSPDD38 pKa = 3.64NIKK41 pKa = 10.65VPVGDD46 pKa = 4.19MIQFQFRR53 pKa = 11.84AGNHH57 pKa = 5.33SVVQSNFDD65 pKa = 3.78NPCEE69 pKa = 4.27PIKK72 pKa = 10.27MHH74 pKa = 6.55TGAEE78 pKa = 4.33GFYY81 pKa = 10.58SGYY84 pKa = 10.22QLVAASEE91 pKa = 4.16EE92 pKa = 4.03MDD94 pKa = 5.55LIPTYY99 pKa = 10.56TVMVQDD105 pKa = 4.81EE106 pKa = 4.75SPMWVYY112 pKa = 10.76CSQGQHH118 pKa = 5.89CQNGMVMVVNEE129 pKa = 3.88NTAANSSRR137 pKa = 11.84SLEE140 pKa = 4.11EE141 pKa = 3.78YY142 pKa = 10.61RR143 pKa = 11.84NLAAEE148 pKa = 4.63APDD151 pKa = 3.81NLAGDD156 pKa = 3.84VEE158 pKa = 4.95GIGGEE163 pKa = 4.24TGTTPEE169 pKa = 3.97PTEE172 pKa = 4.77PGDD175 pKa = 3.72EE176 pKa = 4.02TDD178 pKa = 3.94APSDD182 pKa = 3.81EE183 pKa = 4.63EE184 pKa = 4.58TPATPGDD191 pKa = 4.28DD192 pKa = 3.72DD193 pKa = 4.21TTTGDD198 pKa = 3.86DD199 pKa = 3.56TTGDD203 pKa = 3.54EE204 pKa = 4.46TLTPGSDD211 pKa = 3.15ATPTEE216 pKa = 4.31TADD219 pKa = 3.52GAASGTEE226 pKa = 3.96AADD229 pKa = 3.6EE230 pKa = 4.58ASTSVAQVGGGSMVTVTSPMGFFALAAAFFMLL262 pKa = 5.12
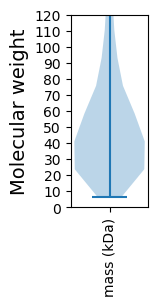
Molecular weight: 27.4 kDa
Isoelectric point according different methods:
Protein with the highest isoelectric point:
>tr|A0A4Q4T0V2|A0A4Q4T0V2_9PEZI t-SNARE coiled-coil homology domain-containing protein OS=Monosporascus ibericus OX=155417 GN=DL764_008454 PE=4 SV=1
MM1 pKa = 7.14MRR3 pKa = 11.84PFTVAVSAVRR13 pKa = 11.84TALSGAQSRR22 pKa = 11.84STIITTASKK31 pKa = 9.62RR32 pKa = 11.84TFSSLPQLRR41 pKa = 11.84PSILPPAHH49 pKa = 5.16GTVFRR54 pKa = 11.84PANNAVSRR62 pKa = 11.84VSLTPSVPAGATGPEE77 pKa = 4.1ALDD80 pKa = 4.18LVPKK84 pKa = 9.25TAITAHH90 pKa = 6.85PALAGVQIRR99 pKa = 11.84CGPRR103 pKa = 11.84PTMARR108 pKa = 11.84SSRR111 pKa = 11.84LIRR114 pKa = 11.84KK115 pKa = 8.73RR116 pKa = 11.84RR117 pKa = 11.84HH118 pKa = 5.22GFLSRR123 pKa = 11.84LRR125 pKa = 11.84TRR127 pKa = 11.84NGRR130 pKa = 11.84KK131 pKa = 8.2MLQRR135 pKa = 11.84RR136 pKa = 11.84KK137 pKa = 9.87DD138 pKa = 3.25KK139 pKa = 10.74KK140 pKa = 10.63RR141 pKa = 11.84SVLSMM146 pKa = 4.25
MM1 pKa = 7.14MRR3 pKa = 11.84PFTVAVSAVRR13 pKa = 11.84TALSGAQSRR22 pKa = 11.84STIITTASKK31 pKa = 9.62RR32 pKa = 11.84TFSSLPQLRR41 pKa = 11.84PSILPPAHH49 pKa = 5.16GTVFRR54 pKa = 11.84PANNAVSRR62 pKa = 11.84VSLTPSVPAGATGPEE77 pKa = 4.1ALDD80 pKa = 4.18LVPKK84 pKa = 9.25TAITAHH90 pKa = 6.85PALAGVQIRR99 pKa = 11.84CGPRR103 pKa = 11.84PTMARR108 pKa = 11.84SSRR111 pKa = 11.84LIRR114 pKa = 11.84KK115 pKa = 8.73RR116 pKa = 11.84RR117 pKa = 11.84HH118 pKa = 5.22GFLSRR123 pKa = 11.84LRR125 pKa = 11.84TRR127 pKa = 11.84NGRR130 pKa = 11.84KK131 pKa = 8.2MLQRR135 pKa = 11.84RR136 pKa = 11.84KK137 pKa = 9.87DD138 pKa = 3.25KK139 pKa = 10.74KK140 pKa = 10.63RR141 pKa = 11.84SVLSMM146 pKa = 4.25
Molecular weight: 15.87 kDa
Isoelectric point according different methods:
Peptides (in silico digests for buttom-up proteomics)
Below you can find in silico digests of the whole proteome with Trypsin, Chymotrypsin, Trypsin+LysC, LysN, ArgC proteases suitable for different mass spec machines.| Try ESI |
 |
|---|
| ChTry ESI |
 |
|---|
| ArgC ESI |
 |
|---|
| LysN ESI |
 |
|---|
| TryLysC ESI |
 |
|---|
| Try MALDI |
 |
|---|
| ChTry MALDI |
 |
|---|
| ArgC MALDI |
 |
|---|
| LysN MALDI |
 |
|---|
| TryLysC MALDI |
 |
|---|
| Try LTQ |
 |
|---|
| ChTry LTQ |
 |
|---|
| ArgC LTQ |
 |
|---|
| LysN LTQ |
 |
|---|
| TryLysC LTQ |
 |
|---|
| Try MSlow |
 |
|---|
| ChTry MSlow |
 |
|---|
| ArgC MSlow |
 |
|---|
| LysN MSlow |
 |
|---|
| TryLysC MSlow |
 |
|---|
| Try MShigh |
 |
|---|
| ChTry MShigh |
 |
|---|
| ArgC MShigh |
 |
|---|
| LysN MShigh |
 |
|---|
| TryLysC MShigh |
 |
|---|
General Statistics
Number of major isoforms |
Number of additional isoforms |
Number of all proteins |
Number of amino acids |
Min. Seq. Length |
Max. Seq. Length |
Avg. Seq. Length |
Avg. Mol. Weight |
|---|---|---|---|---|---|---|---|
0 |
5384106 |
66 |
15764 |
486.9 |
53.69 |
Amino acid frequency
Ala |
Cys |
Asp |
Glu |
Phe |
Gly |
His |
Ile |
Lys |
Leu |
|---|---|---|---|---|---|---|---|---|---|
9.241 ± 0.021 | 1.163 ± 0.009 |
5.91 ± 0.016 | 6.377 ± 0.022 |
3.535 ± 0.014 | 7.315 ± 0.023 |
2.327 ± 0.009 | 4.478 ± 0.015 |
4.621 ± 0.019 | 8.71 ± 0.025 |
Met |
Asn |
Gln |
Pro |
Arg |
Ser |
Thr |
Val |
Trp |
Tyr |
|---|---|---|---|---|---|---|---|---|---|
2.111 ± 0.009 | 3.522 ± 0.013 |
6.22 ± 0.028 | 3.875 ± 0.017 |
6.579 ± 0.022 | 7.884 ± 0.027 |
5.775 ± 0.016 | 6.2 ± 0.016 |
1.448 ± 0.008 | 2.707 ± 0.011 |
Most of the basic statistics you can see at this page can be downloaded from this CSV file
Proteome-pI is available under Creative Commons Attribution-NoDerivs license, for more details see here
| Reference: Kozlowski LP. Proteome-pI 2.0: Proteome Isoelectric Point Database Update. Nucleic Acids Res. 2021, doi: 10.1093/nar/gkab944 | Contact: Lukasz P. Kozlowski |
