Pectobacterium phage MA2
Taxonomy: Viruses; Duplodnaviria; Heunggongvirae; Uroviricota; Caudoviricetes; Caudovirales; Autographiviridae; Corkvirinae; Kotilavirus; unclassified Kotilavirus
Average proteome isoelectric point is 6.36
Get precalculated fractions of proteins

Virtual 2D-PAGE plot for 34 proteins (isoelectric point calculated using IPC2_protein)
Get csv file with sequences according to given criteria:
* You can choose from 21 different methods for calculating isoelectric point
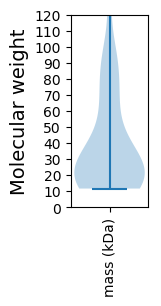
Summary statistics related to proteome-wise predictions


Protein with the lowest isoelectric point:
>tr|A0A5Q2F404|A0A5Q2F404_9CAUD Uncharacterized protein OS=Pectobacterium phage MA2 OX=2608298 GN=MA2_07 PE=4 SV=1
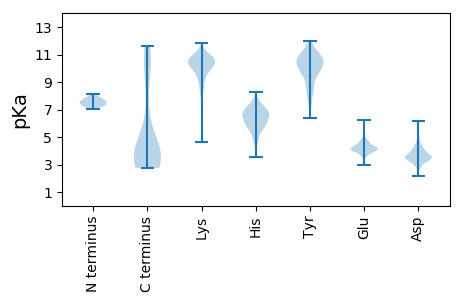
MM1 pKa = 7.42YY2 pKa = 9.95SVQIAVSDD10 pKa = 4.2GSLSRR15 pKa = 11.84IALSIEE21 pKa = 4.04YY22 pKa = 10.05FEE24 pKa = 6.23KK25 pKa = 10.88DD26 pKa = 4.01DD27 pKa = 3.51ISLYY31 pKa = 10.61RR32 pKa = 11.84NLSTVPMVLGDD43 pKa = 3.35DD44 pKa = 3.98WQWDD48 pKa = 3.42GDD50 pKa = 3.71AHH52 pKa = 7.08INLLSDD58 pKa = 3.55VPVPNGGYY66 pKa = 7.81ITVRR70 pKa = 11.84RR71 pKa = 11.84NTNIDD76 pKa = 3.36RR77 pKa = 11.84AFNIYY82 pKa = 10.56DD83 pKa = 3.51GGAAFTRR90 pKa = 11.84DD91 pKa = 3.39TLDD94 pKa = 3.28EE95 pKa = 4.31NFKK98 pKa = 11.21QMIYY102 pKa = 10.2LAQEE106 pKa = 3.97FTEE109 pKa = 4.83GNGLTGLFFPLNMNGFKK126 pKa = 9.12ITNLGAGTDD135 pKa = 4.25DD136 pKa = 3.86KK137 pKa = 11.79DD138 pKa = 4.07AVNKK142 pKa = 10.0GQLDD146 pKa = 4.07GVSDD150 pKa = 3.82RR151 pKa = 11.84VSSLEE156 pKa = 3.88GTFVTGTTSYY166 pKa = 10.17PWYY169 pKa = 9.47TITTEE174 pKa = 3.89PTLVFSPPFLFTKK187 pKa = 10.47AALYY191 pKa = 10.83LNGVCQVPGLSYY203 pKa = 10.84SVSNNQIRR211 pKa = 11.84LATNVAPGTVVFARR225 pKa = 11.84LGEE228 pKa = 4.38DD229 pKa = 2.79TDD231 pKa = 3.88AATEE235 pKa = 4.25GVTQAQFLALMARR248 pKa = 11.84VEE250 pKa = 4.05ALEE253 pKa = 4.05NPP255 pKa = 4.01
MM1 pKa = 7.42YY2 pKa = 9.95SVQIAVSDD10 pKa = 4.2GSLSRR15 pKa = 11.84IALSIEE21 pKa = 4.04YY22 pKa = 10.05FEE24 pKa = 6.23KK25 pKa = 10.88DD26 pKa = 4.01DD27 pKa = 3.51ISLYY31 pKa = 10.61RR32 pKa = 11.84NLSTVPMVLGDD43 pKa = 3.35DD44 pKa = 3.98WQWDD48 pKa = 3.42GDD50 pKa = 3.71AHH52 pKa = 7.08INLLSDD58 pKa = 3.55VPVPNGGYY66 pKa = 7.81ITVRR70 pKa = 11.84RR71 pKa = 11.84NTNIDD76 pKa = 3.36RR77 pKa = 11.84AFNIYY82 pKa = 10.56DD83 pKa = 3.51GGAAFTRR90 pKa = 11.84DD91 pKa = 3.39TLDD94 pKa = 3.28EE95 pKa = 4.31NFKK98 pKa = 11.21QMIYY102 pKa = 10.2LAQEE106 pKa = 3.97FTEE109 pKa = 4.83GNGLTGLFFPLNMNGFKK126 pKa = 9.12ITNLGAGTDD135 pKa = 4.25DD136 pKa = 3.86KK137 pKa = 11.79DD138 pKa = 4.07AVNKK142 pKa = 10.0GQLDD146 pKa = 4.07GVSDD150 pKa = 3.82RR151 pKa = 11.84VSSLEE156 pKa = 3.88GTFVTGTTSYY166 pKa = 10.17PWYY169 pKa = 9.47TITTEE174 pKa = 3.89PTLVFSPPFLFTKK187 pKa = 10.47AALYY191 pKa = 10.83LNGVCQVPGLSYY203 pKa = 10.84SVSNNQIRR211 pKa = 11.84LATNVAPGTVVFARR225 pKa = 11.84LGEE228 pKa = 4.38DD229 pKa = 2.79TDD231 pKa = 3.88AATEE235 pKa = 4.25GVTQAQFLALMARR248 pKa = 11.84VEE250 pKa = 4.05ALEE253 pKa = 4.05NPP255 pKa = 4.01
Molecular weight: 27.83 kDa
Isoelectric point according different methods:
Protein with the highest isoelectric point:
>tr|A0A5Q2F5A2|A0A5Q2F5A2_9CAUD Putative tubular protein A OS=Pectobacterium phage MA2 OX=2608298 GN=MA2_27 PE=4 SV=1
MM1 pKa = 7.74RR2 pKa = 11.84KK3 pKa = 9.21LARR6 pKa = 11.84SQVRR10 pKa = 11.84PTAMRR15 pKa = 11.84LLQQQGGVCPLCNKK29 pKa = 9.8PVDD32 pKa = 4.14LTEE35 pKa = 4.52KK36 pKa = 10.37GALVLDD42 pKa = 4.54HH43 pKa = 7.41DD44 pKa = 4.86HH45 pKa = 6.51GTGQVRR51 pKa = 11.84GALHH55 pKa = 6.9RR56 pKa = 11.84SCNSAEE62 pKa = 3.99GKK64 pKa = 9.22VANAAGRR71 pKa = 11.84WGAKK75 pKa = 7.3SMRR78 pKa = 11.84YY79 pKa = 9.14EE80 pKa = 4.59DD81 pKa = 3.22IVPFLEE87 pKa = 4.18RR88 pKa = 11.84LVAYY92 pKa = 9.97LRR94 pKa = 11.84QPPQDD99 pKa = 3.34MIYY102 pKa = 8.45PTFKK106 pKa = 10.29TADD109 pKa = 3.98EE110 pKa = 4.12LRR112 pKa = 11.84MARR115 pKa = 11.84NVKK118 pKa = 9.38EE119 pKa = 3.84RR120 pKa = 11.84TRR122 pKa = 11.84RR123 pKa = 11.84AEE125 pKa = 3.75RR126 pKa = 11.84KK127 pKa = 9.17ARR129 pKa = 11.84EE130 pKa = 3.83TVRR133 pKa = 11.84RR134 pKa = 11.84SRR136 pKa = 11.84VNKK139 pKa = 9.72QDD141 pKa = 3.0
MM1 pKa = 7.74RR2 pKa = 11.84KK3 pKa = 9.21LARR6 pKa = 11.84SQVRR10 pKa = 11.84PTAMRR15 pKa = 11.84LLQQQGGVCPLCNKK29 pKa = 9.8PVDD32 pKa = 4.14LTEE35 pKa = 4.52KK36 pKa = 10.37GALVLDD42 pKa = 4.54HH43 pKa = 7.41DD44 pKa = 4.86HH45 pKa = 6.51GTGQVRR51 pKa = 11.84GALHH55 pKa = 6.9RR56 pKa = 11.84SCNSAEE62 pKa = 3.99GKK64 pKa = 9.22VANAAGRR71 pKa = 11.84WGAKK75 pKa = 7.3SMRR78 pKa = 11.84YY79 pKa = 9.14EE80 pKa = 4.59DD81 pKa = 3.22IVPFLEE87 pKa = 4.18RR88 pKa = 11.84LVAYY92 pKa = 9.97LRR94 pKa = 11.84QPPQDD99 pKa = 3.34MIYY102 pKa = 8.45PTFKK106 pKa = 10.29TADD109 pKa = 3.98EE110 pKa = 4.12LRR112 pKa = 11.84MARR115 pKa = 11.84NVKK118 pKa = 9.38EE119 pKa = 3.84RR120 pKa = 11.84TRR122 pKa = 11.84RR123 pKa = 11.84AEE125 pKa = 3.75RR126 pKa = 11.84KK127 pKa = 9.17ARR129 pKa = 11.84EE130 pKa = 3.83TVRR133 pKa = 11.84RR134 pKa = 11.84SRR136 pKa = 11.84VNKK139 pKa = 9.72QDD141 pKa = 3.0
Molecular weight: 16.08 kDa
Isoelectric point according different methods:
Peptides (in silico digests for buttom-up proteomics)
Below you can find in silico digests of the whole proteome with Trypsin, Chymotrypsin, Trypsin+LysC, LysN, ArgC proteases suitable for different mass spec machines.| Try ESI |
 |
|---|
| ChTry ESI |
 |
|---|
| ArgC ESI |
 |
|---|
| LysN ESI |
 |
|---|
| TryLysC ESI |
 |
|---|
| Try MALDI |
 |
|---|
| ChTry MALDI |
 |
|---|
| ArgC MALDI |
 |
|---|
| LysN MALDI |
 |
|---|
| TryLysC MALDI |
 |
|---|
| Try LTQ |
 |
|---|
| ChTry LTQ |
 |
|---|
| ArgC LTQ |
 |
|---|
| LysN LTQ |
 |
|---|
| TryLysC LTQ |
 |
|---|
| Try MSlow |
 |
|---|
| ChTry MSlow |
 |
|---|
| ArgC MSlow |
 |
|---|
| LysN MSlow |
 |
|---|
| TryLysC MSlow |
 |
|---|
| Try MShigh |
 |
|---|
| ChTry MShigh |
 |
|---|
| ArgC MShigh |
 |
|---|
| LysN MShigh |
 |
|---|
| TryLysC MShigh |
 |
|---|
General Statistics
Number of major isoforms |
Number of additional isoforms |
Number of all proteins |
Number of amino acids |
Min. Seq. Length |
Max. Seq. Length |
Avg. Seq. Length |
Avg. Mol. Weight |
|---|---|---|---|---|---|---|---|
0 |
11986 |
104 |
1230 |
352.5 |
38.99 |
Amino acid frequency
Ala |
Cys |
Asp |
Glu |
Phe |
Gly |
His |
Ile |
Lys |
Leu |
|---|---|---|---|---|---|---|---|---|---|
9.469 ± 0.494 | 1.226 ± 0.185 |
6.616 ± 0.253 | 4.964 ± 0.329 |
3.137 ± 0.185 | 7.517 ± 0.234 |
2.127 ± 0.187 | 4.338 ± 0.181 |
4.063 ± 0.265 | 8.76 ± 0.274 |
Met |
Asn |
Gln |
Pro |
Arg |
Ser |
Thr |
Val |
Trp |
Tyr |
|---|---|---|---|---|---|---|---|---|---|
2.953 ± 0.151 | 4.297 ± 0.253 |
4.322 ± 0.211 | 4.53 ± 0.433 |
6.015 ± 0.286 | 6.249 ± 0.3 |
6.508 ± 0.403 | 7.617 ± 0.228 |
1.285 ± 0.129 | 4.005 ± 0.264 |
Most of the basic statistics you can see at this page can be downloaded from this CSV file
Proteome-pI is available under Creative Commons Attribution-NoDerivs license, for more details see here
| Reference: Kozlowski LP. Proteome-pI 2.0: Proteome Isoelectric Point Database Update. Nucleic Acids Res. 2021, doi: 10.1093/nar/gkab944 | Contact: Lukasz P. Kozlowski |
